Prometheus
prometheus pushgateway收集数据:
服务端配置
1 | docker pull prom/pushgateway |
客户端逻辑:
1 | #!/usr/bin/env python |
| 服务 | 端口 | 是否有web界面 | 作用 |
|---|---|---|---|
| prometheus | 9090 | 有 | 作为监控主服务器,拉取并存储时序数据 |
| node-exporter | 9100 | 有 | 收集内核公开的硬件和操作系统指标 |
| grafana | 3000 | 有 | 数据展示可视化 |
| cadvisor | 9595 | 有 | 收集宿主机上运行的所有容器的性能数据 |
一、安装prometheus server
docker pull prom/prometheus
# 拉取prometheus镜像
docker run -d –name prometheus2020 prom/prometheus
# 启动容器
docker cp -a prometheus2020:/etc/prometheus/ $PWD/prometheus
# 复制容器内部的配置文件到宿主机,不用事先创建$PWD/prometheus目录
docker rm -f prometheus2020
# 删除容器
docker run -d –name prometheus2020 -p 9090:9090 -v $PWD/prometheus:/etc/prometheus prom/prometheus
# 启动容器
firewall-cmd –zone=public –add-port=9090/tcp –permanent
firewall-cmd –reload
# 开放防火墙9090端口
访问
prometheus使用的是UTC时间,比当前的北京时间晚8个小时,可勾选Use local time选项使用本地时间

二、安装node-exporter
docker pull prom/node-exporter
# 拉取镜像
docker run -d –name node-exporter2020 -p 9100:9100 -v “/proc:/host/proc:ro” -v “/sys:/host/sys:ro” -v “/:/rootfs:ro” –net=”host” prom/node-exporter
# 启动容器
firewall-cmd –zone=public –add-port=9100/tcp –permanent
firewall-cmd –reload
# 开放防火墙9100端口
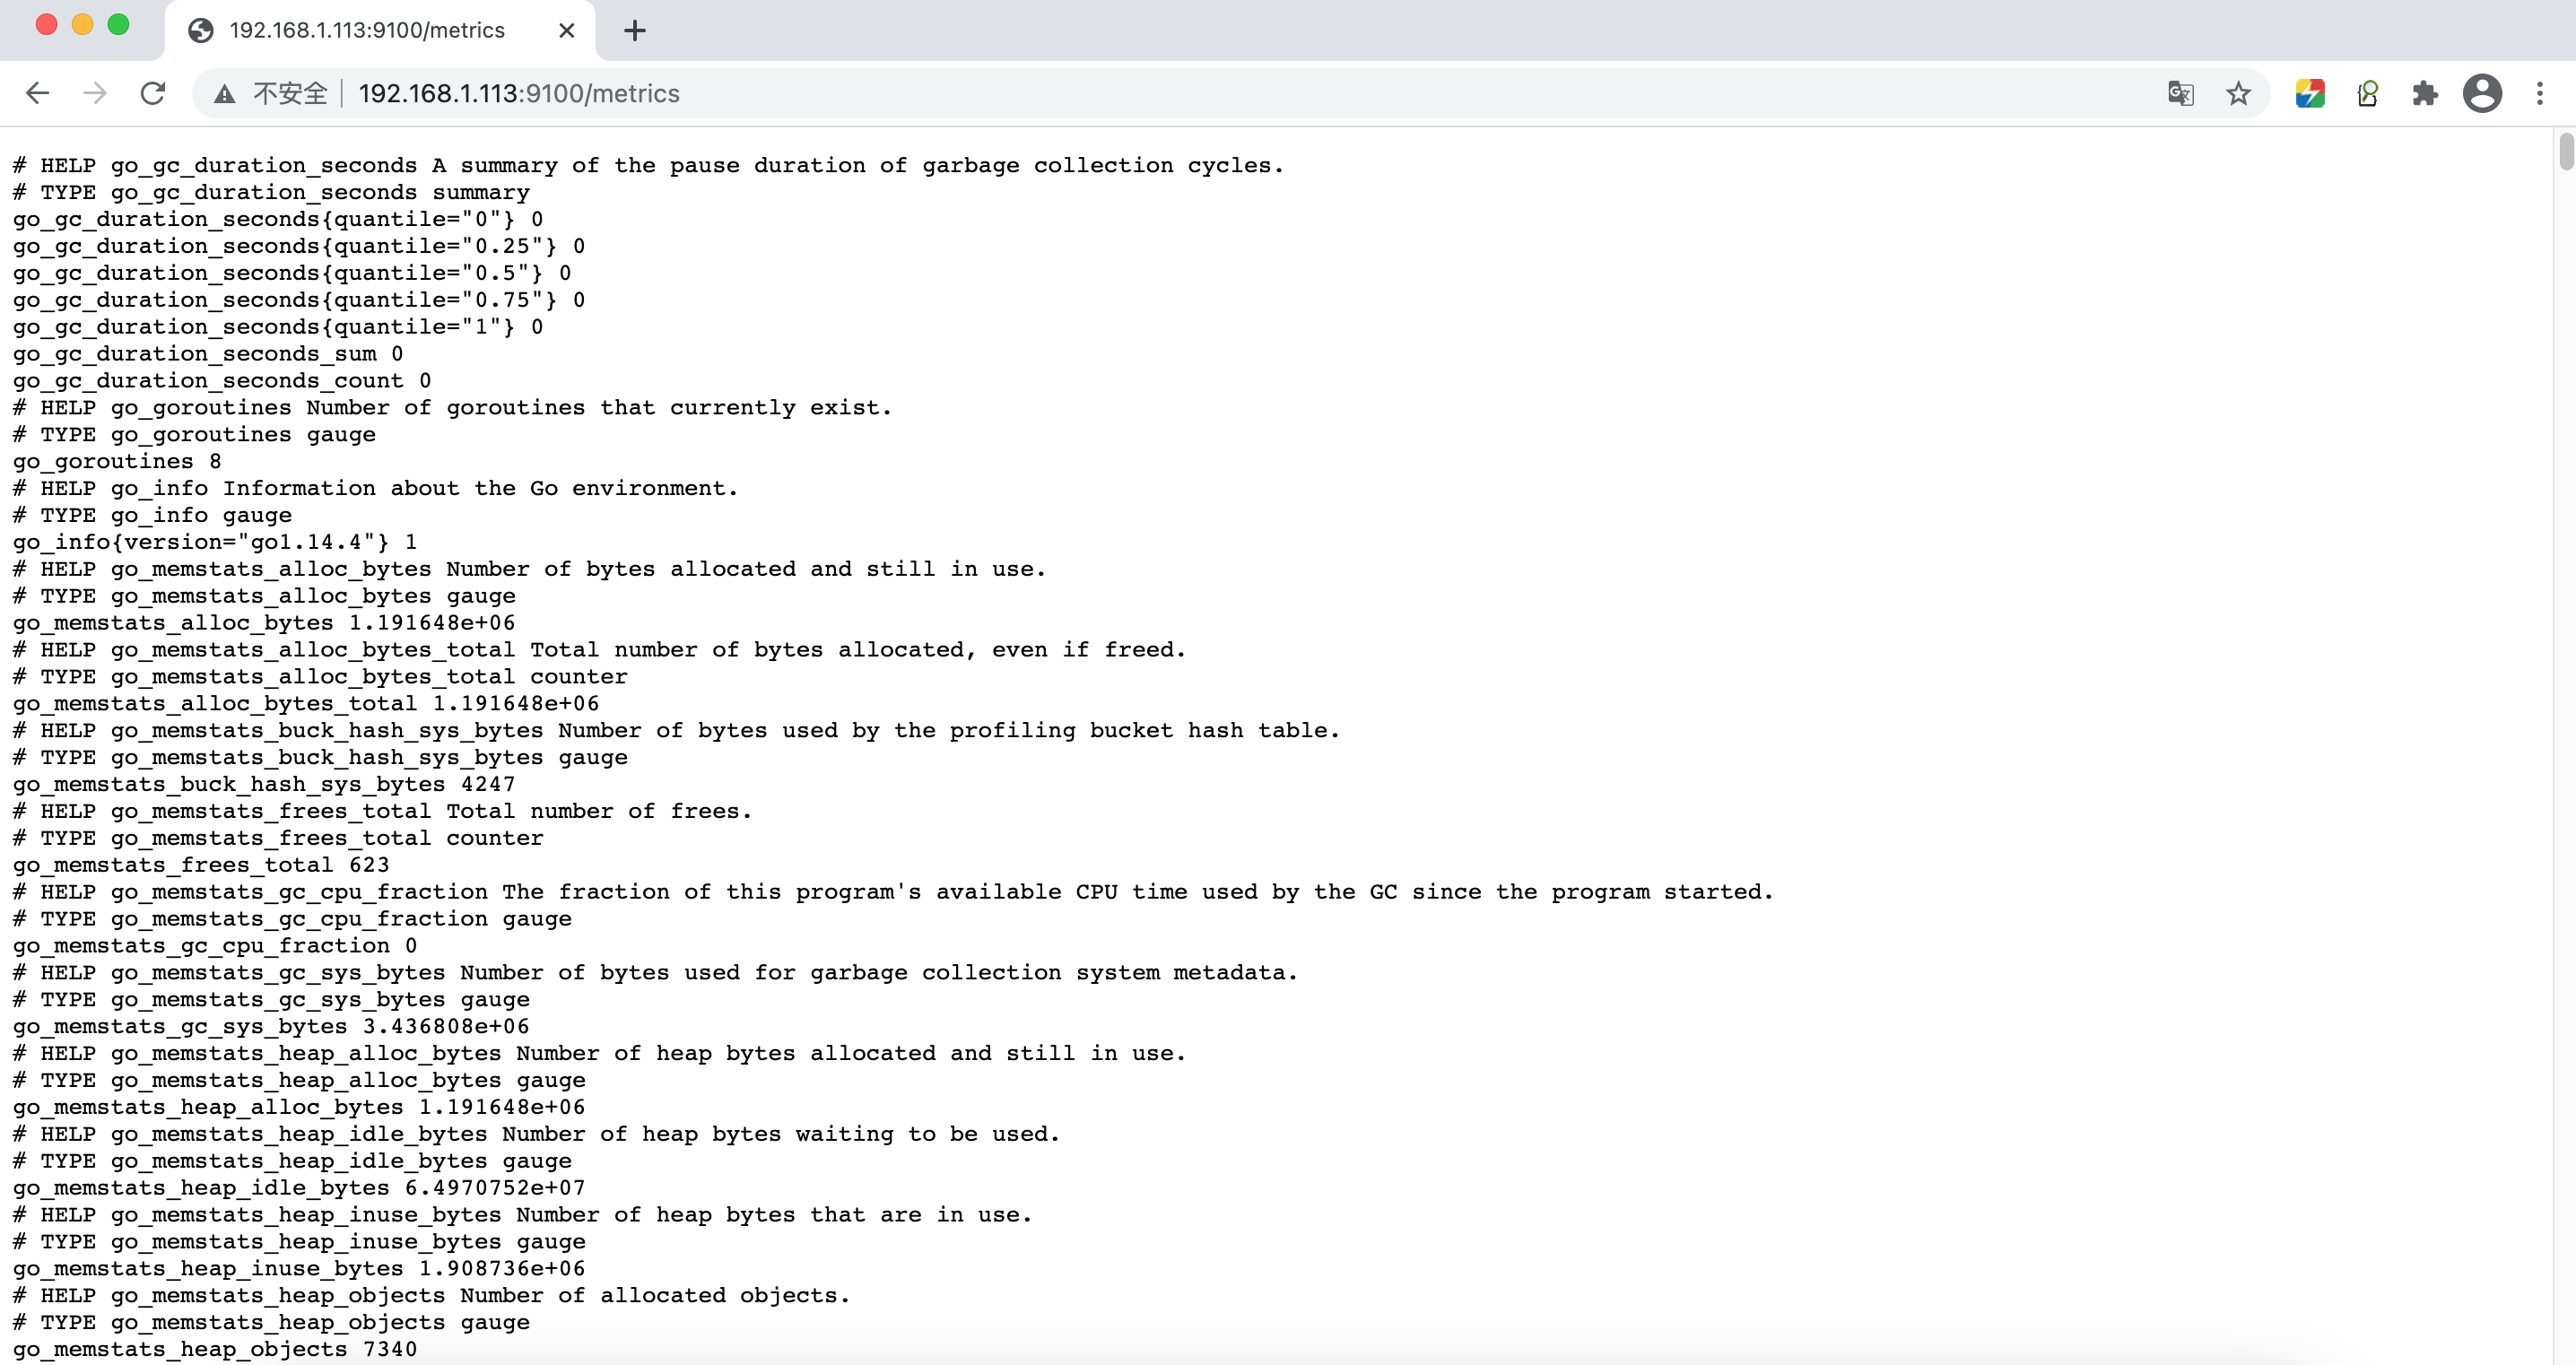
访问
http://192.168.1.113:9100/metrics
vim prometheus/prometheus.yml
# 修改宿主机prometheus配置文件,重启后会同步到容器内部
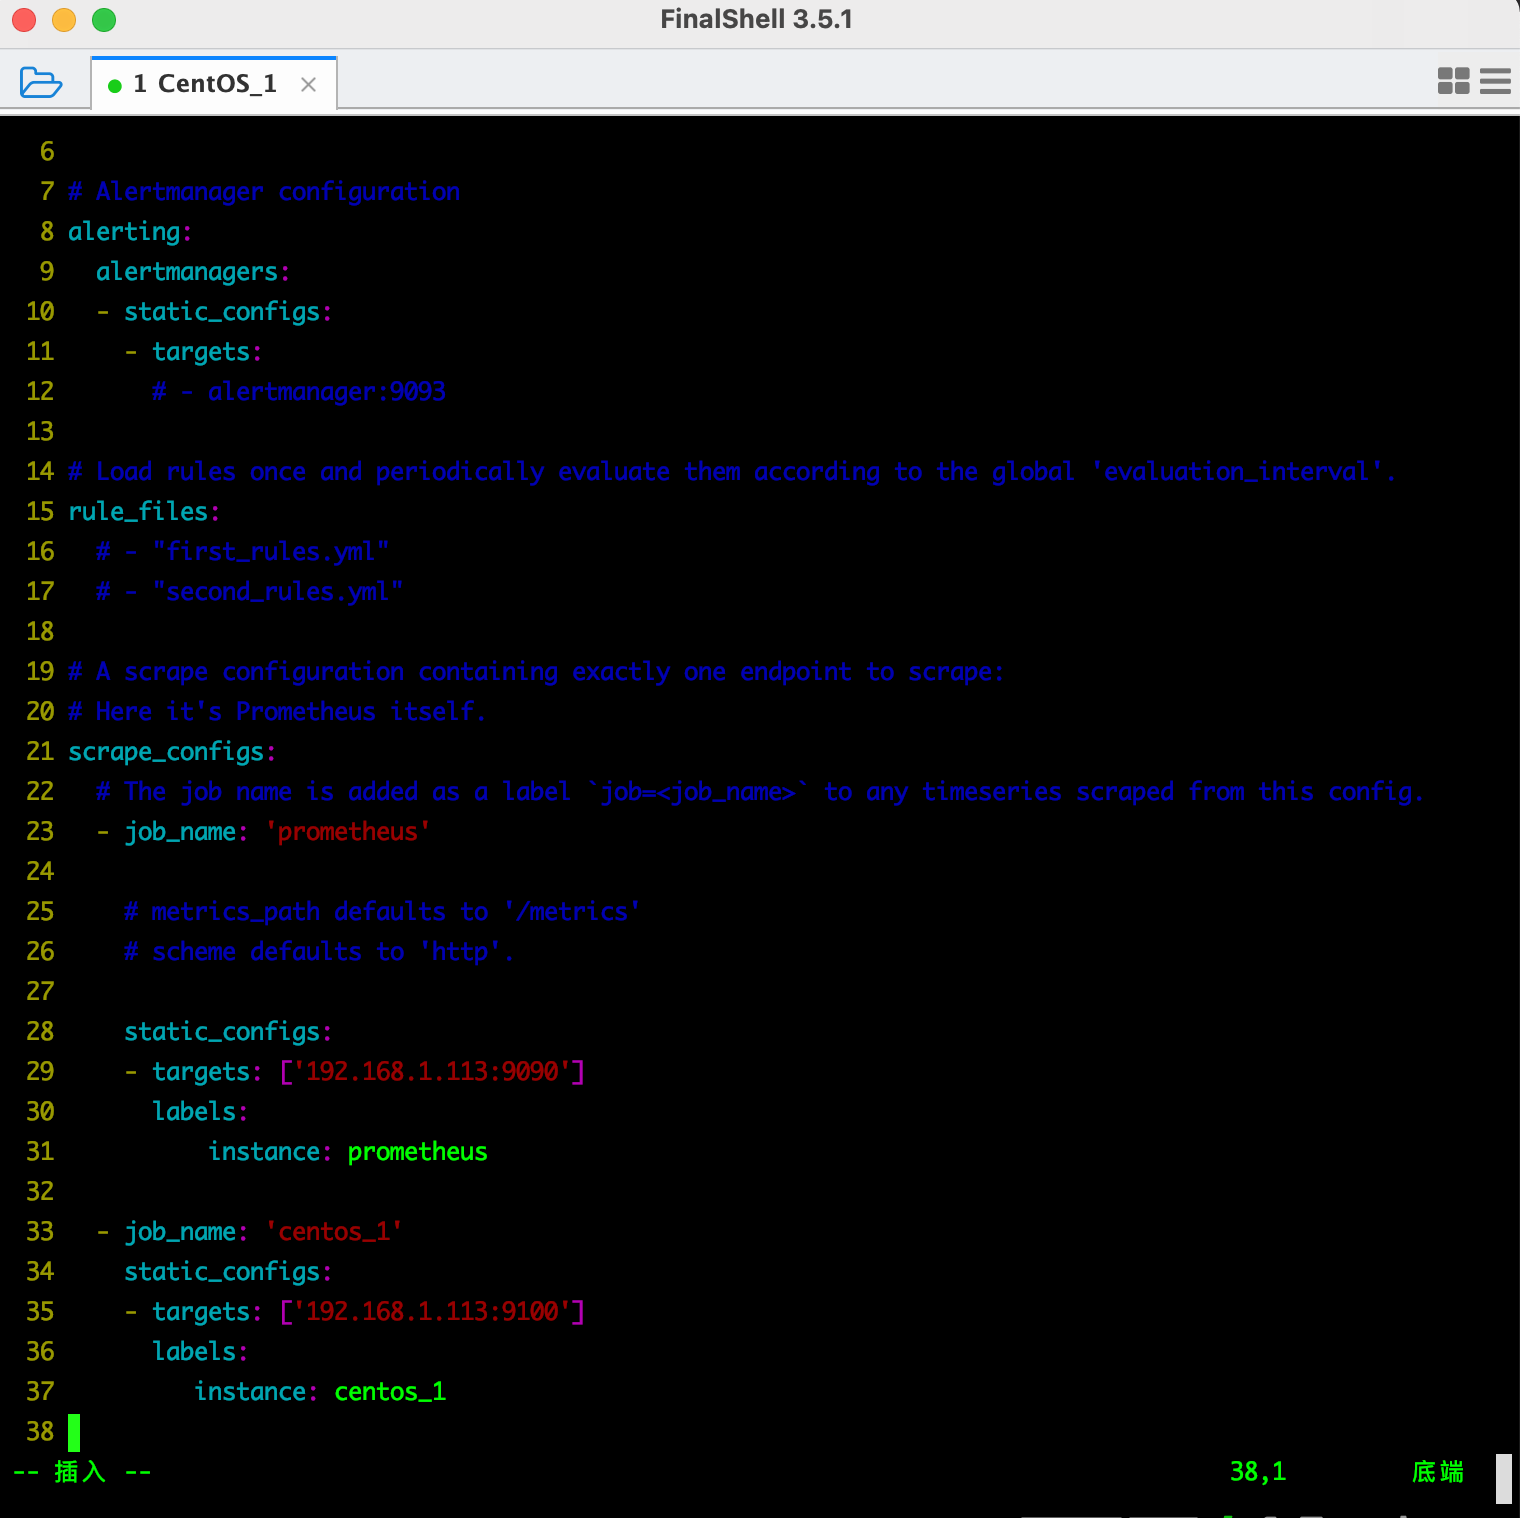
1 | scrape_configs:`` ``# The job name is added as a label `job=<job_name>` to any timeseries scraped from this config.`` ``-` `job_name: ``'prometheus'` ` ``# metrics_path defaults to '/metrics'`` ``# scheme defaults to 'http'.` ` ``static_configs:`` ``-` `targets: [``'192.168.1.113:9090'``]`` ``labels:`` ``instance: prometheus` ` ``-` `job_name: ``'centos_1'`` ``static_configs:`` ``-` `targets: [``'192.168.1.113:9100'``]`` ``labels:`` ``instance: centos_1 |
docker restart prometheus2020
重启容器
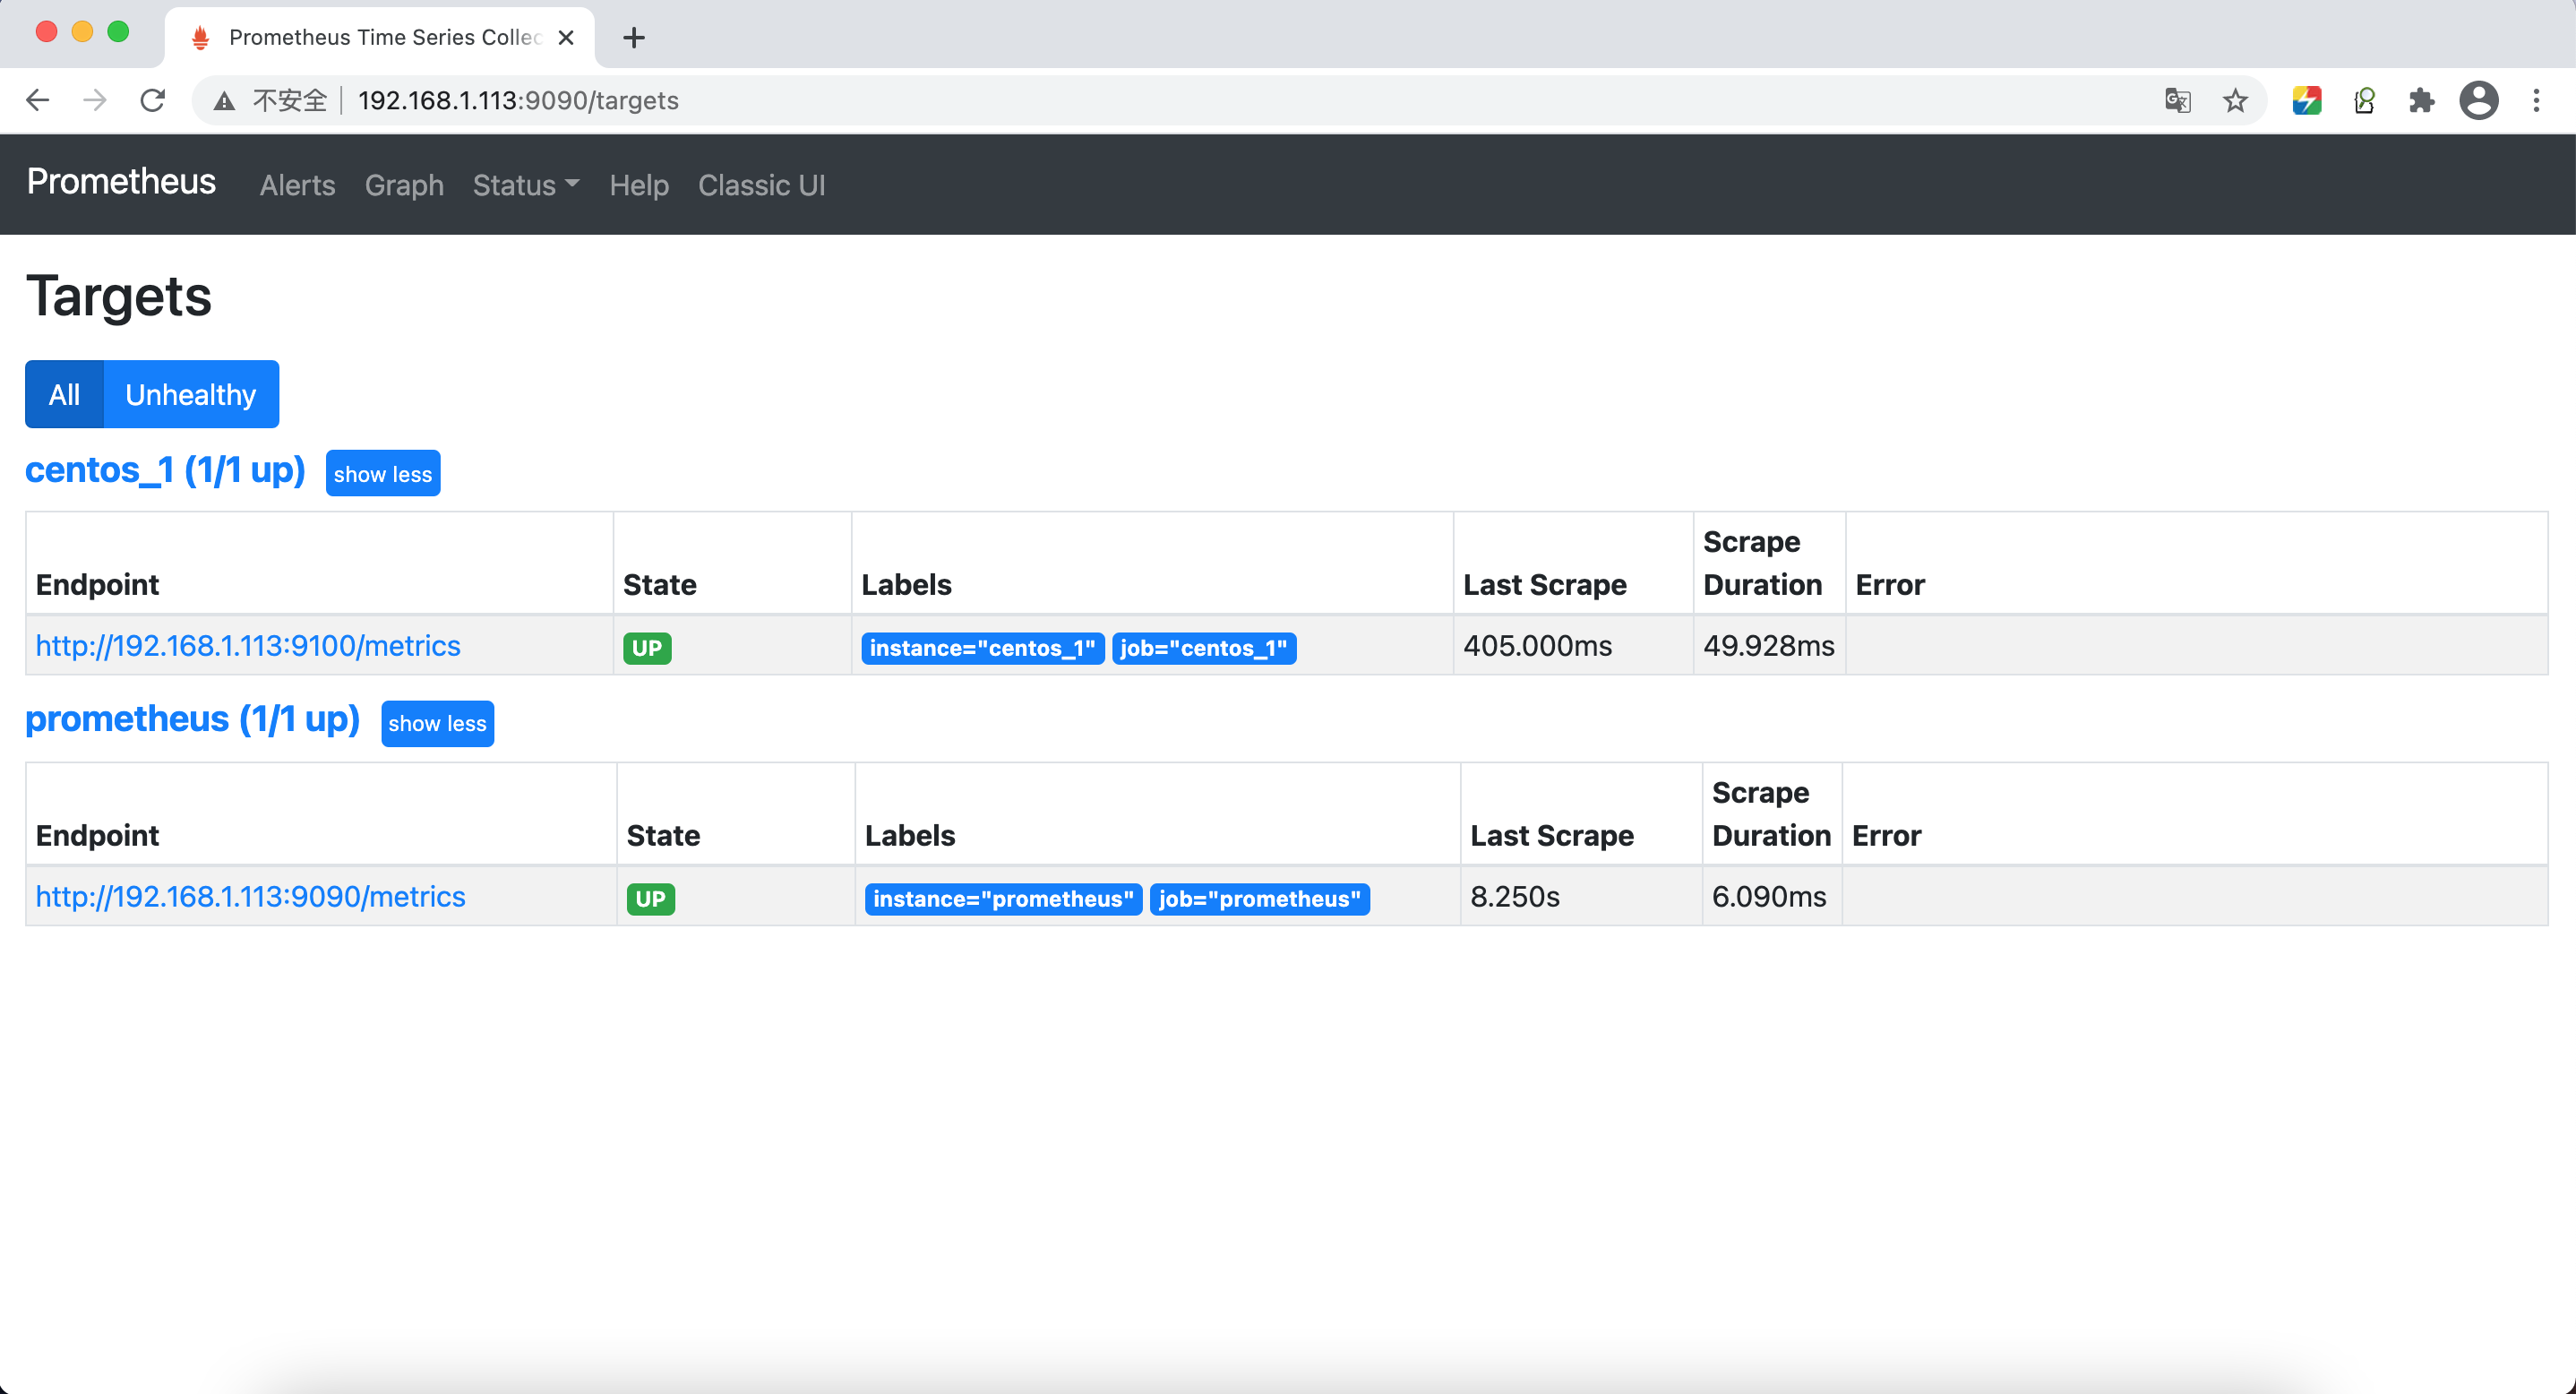
此时再访问
http://192.168.1.113:9090/targets
三、安装grafana
docker pull grafana/grafana
# 拉取镜像
mkdir grafana
# 在宿主机的当前目录下创建grafana目录
chmod 777 -R ./grafana/
# 赋予grafana目录读写权限
# grafana是以grafana用户启动,不是以root用户启动
docker run -d –name=grafana2020 -p 3000:3000 -v $PWD/grafana:/var/lib/grafana grafana/grafana
# 启动容器
firewall-cmd –zone=public –add-port=3000/tcp –permanent
firewall-cmd –reload
# 开放防火墙3000端口
访问
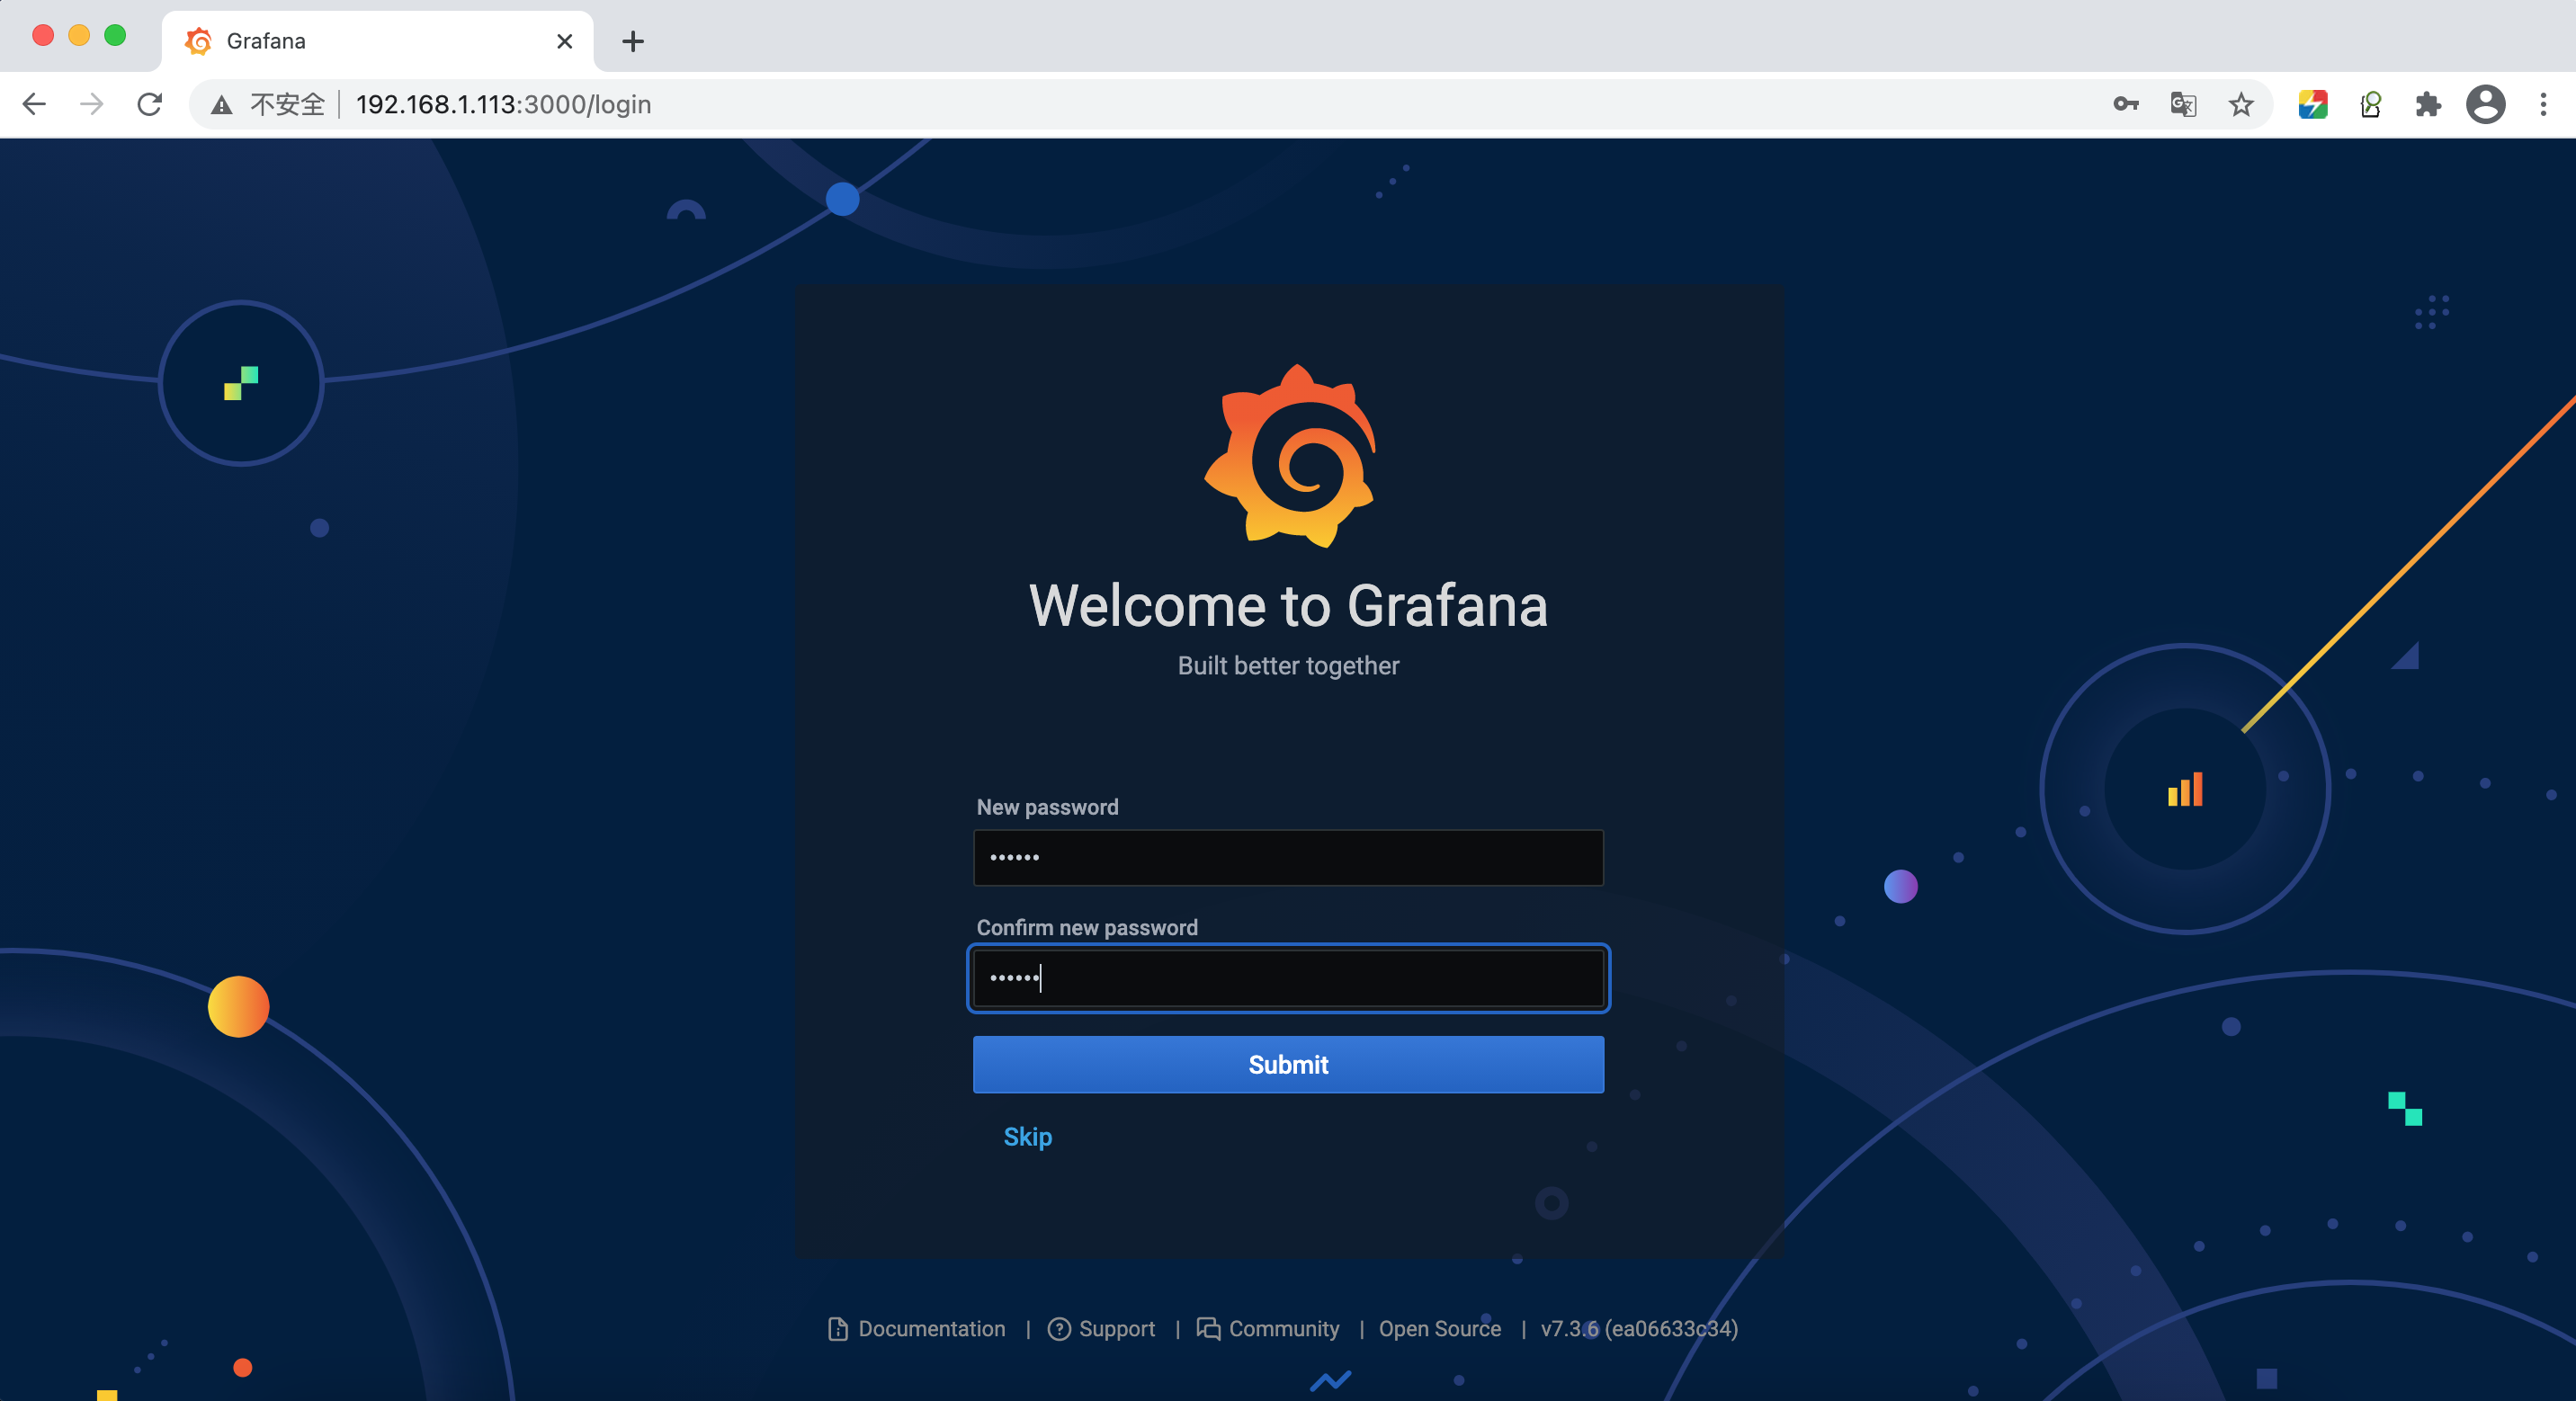
用户名:admin
密码:admin

修改密码为:123456
并二次确认
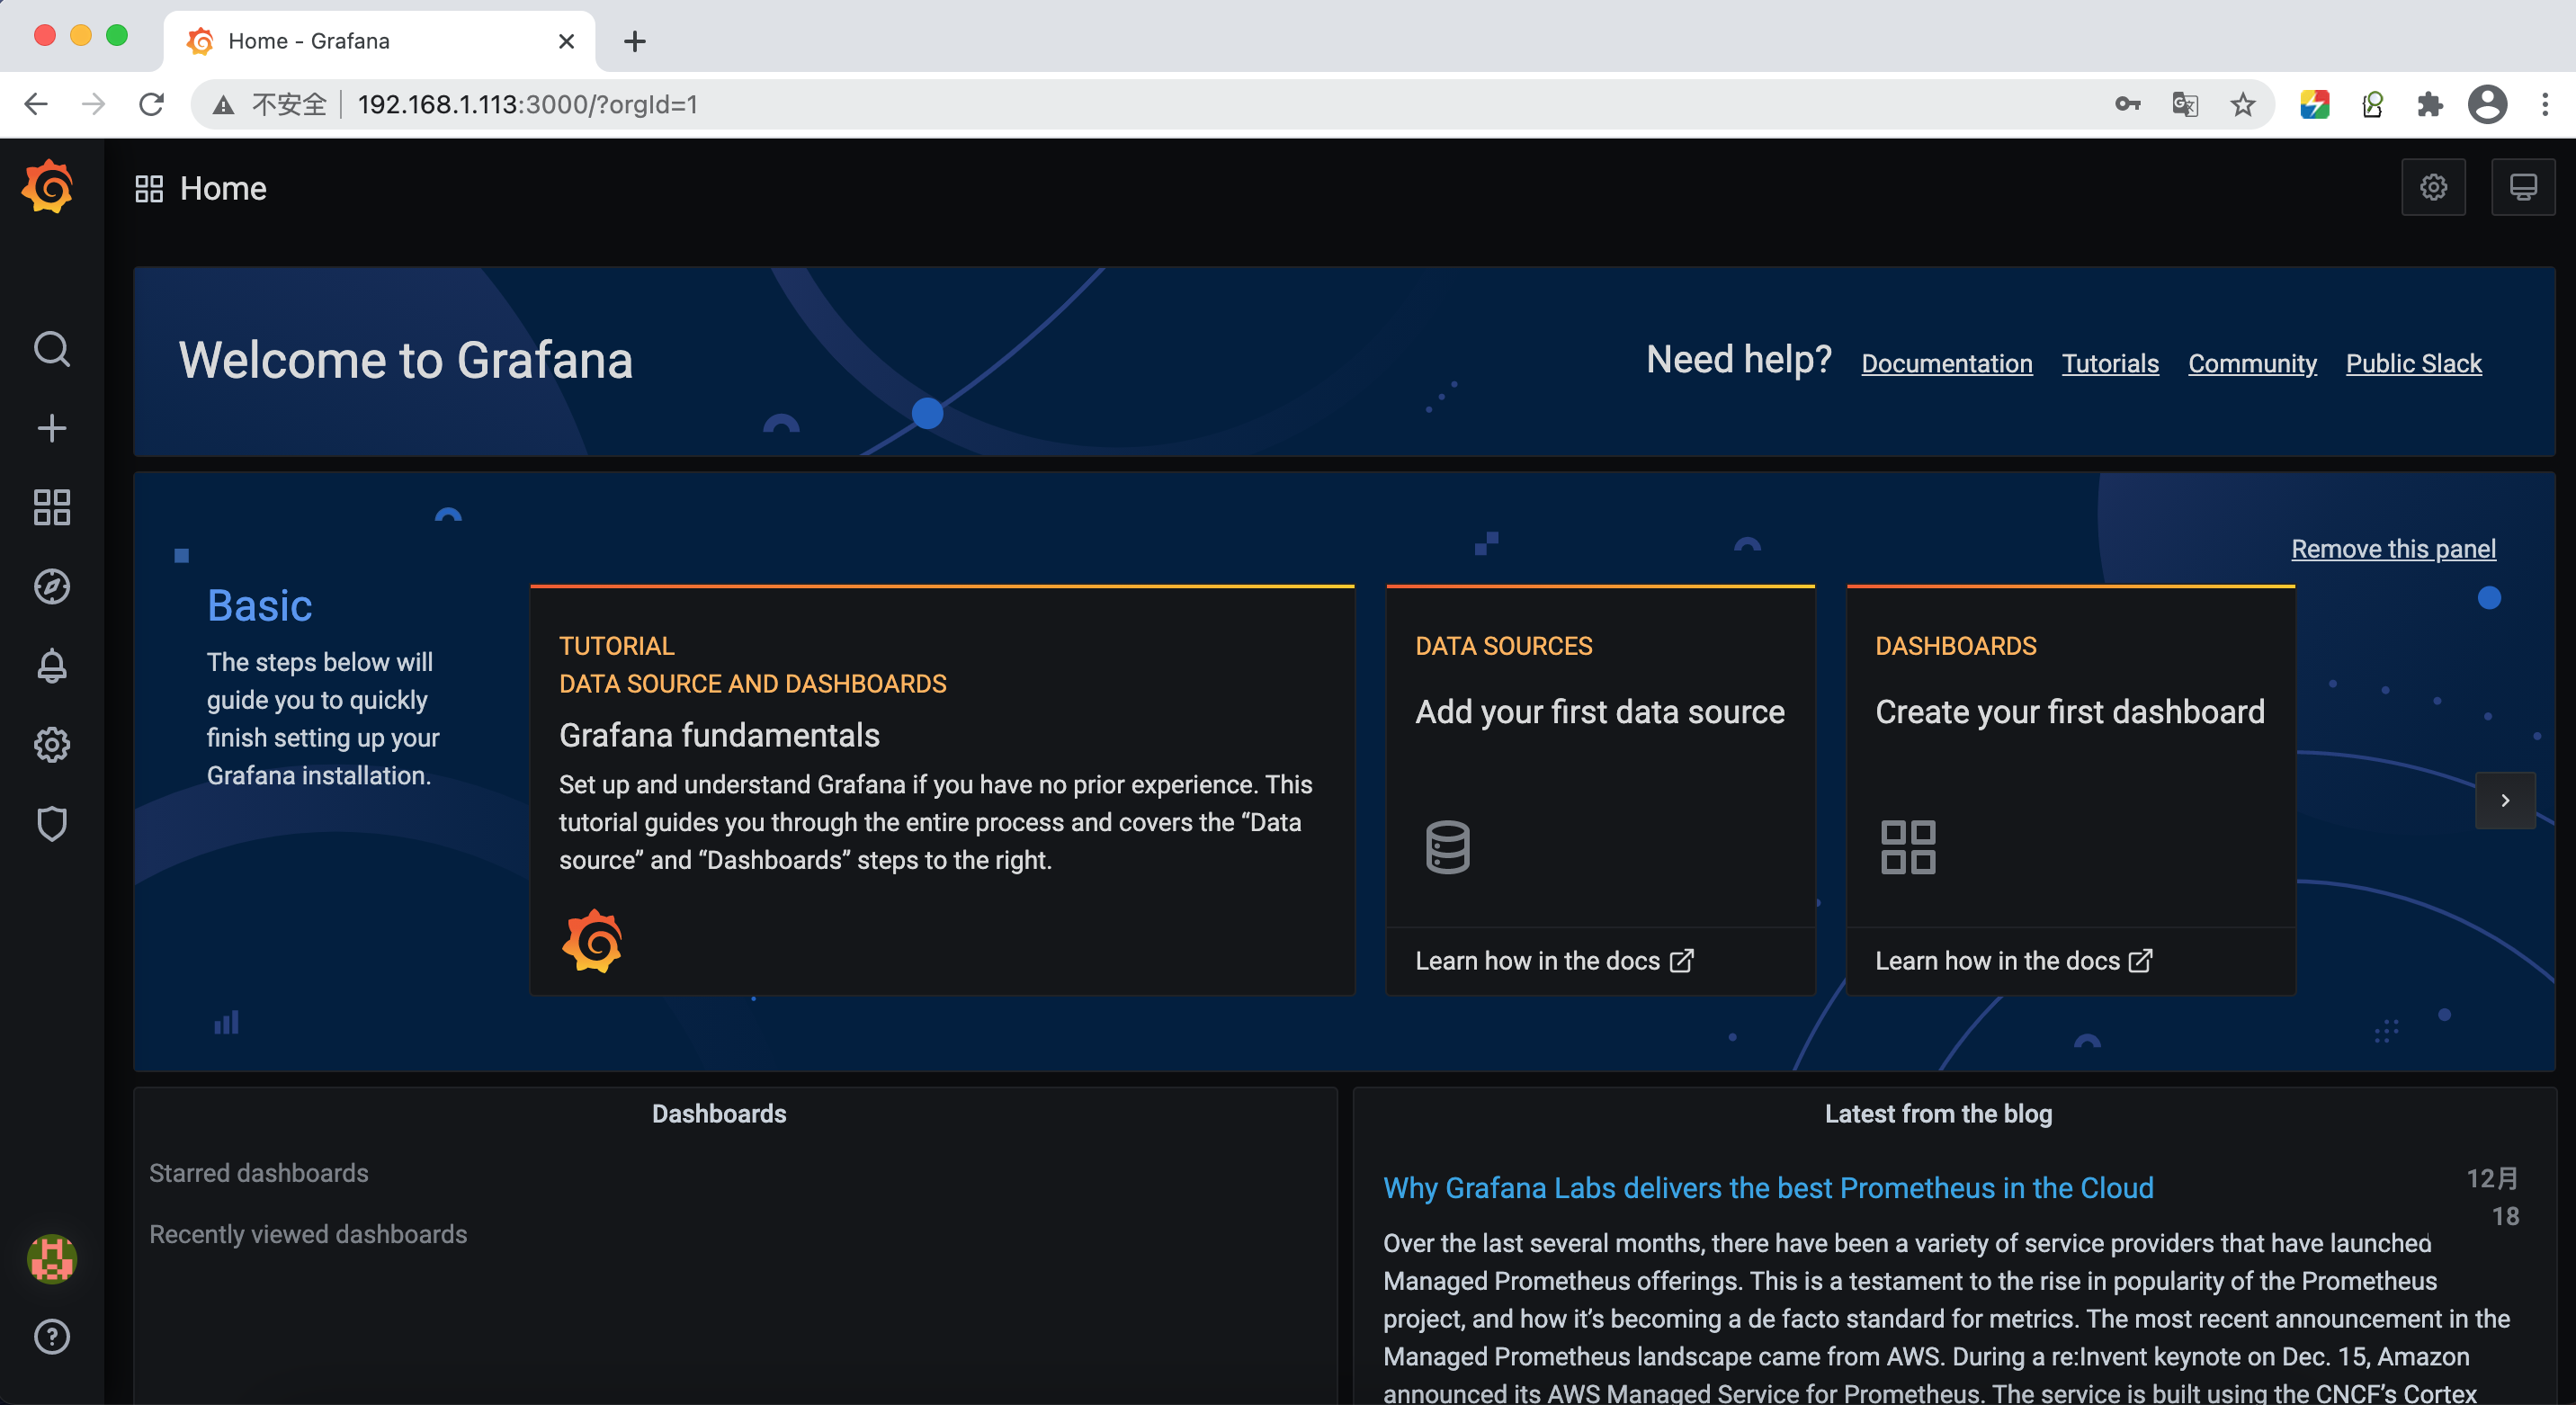
首页:
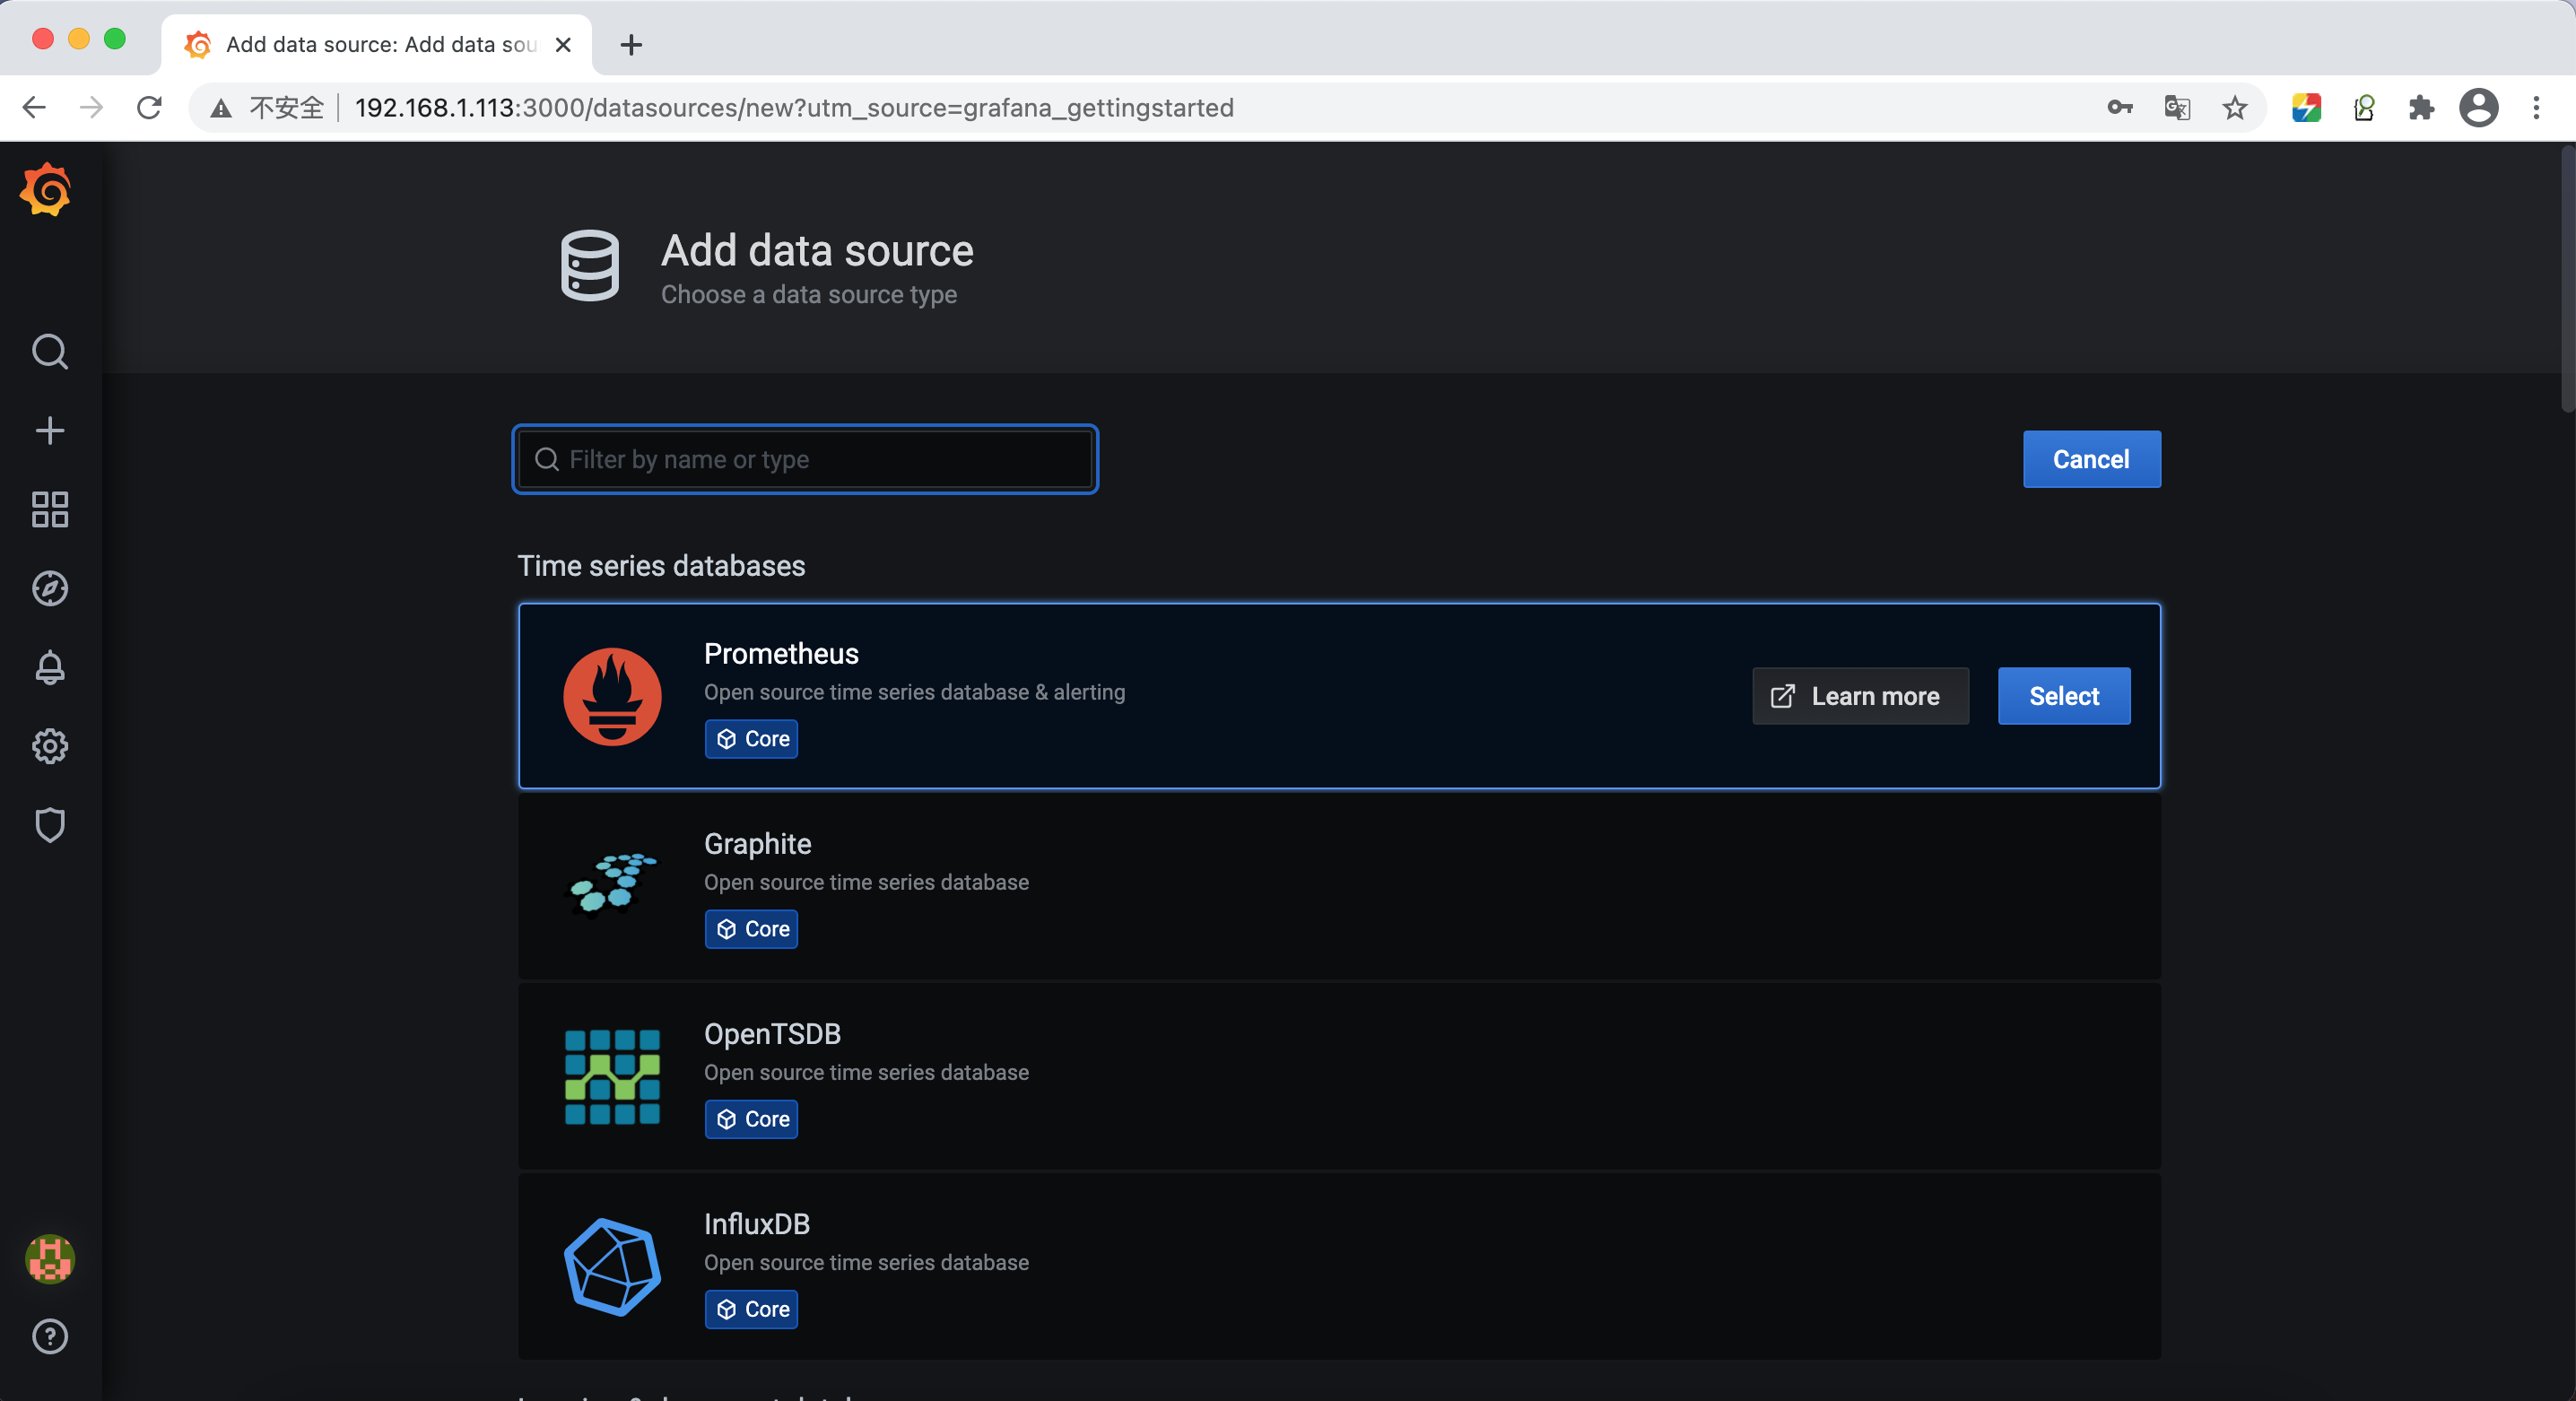
添加数据源,选择Prometheus:
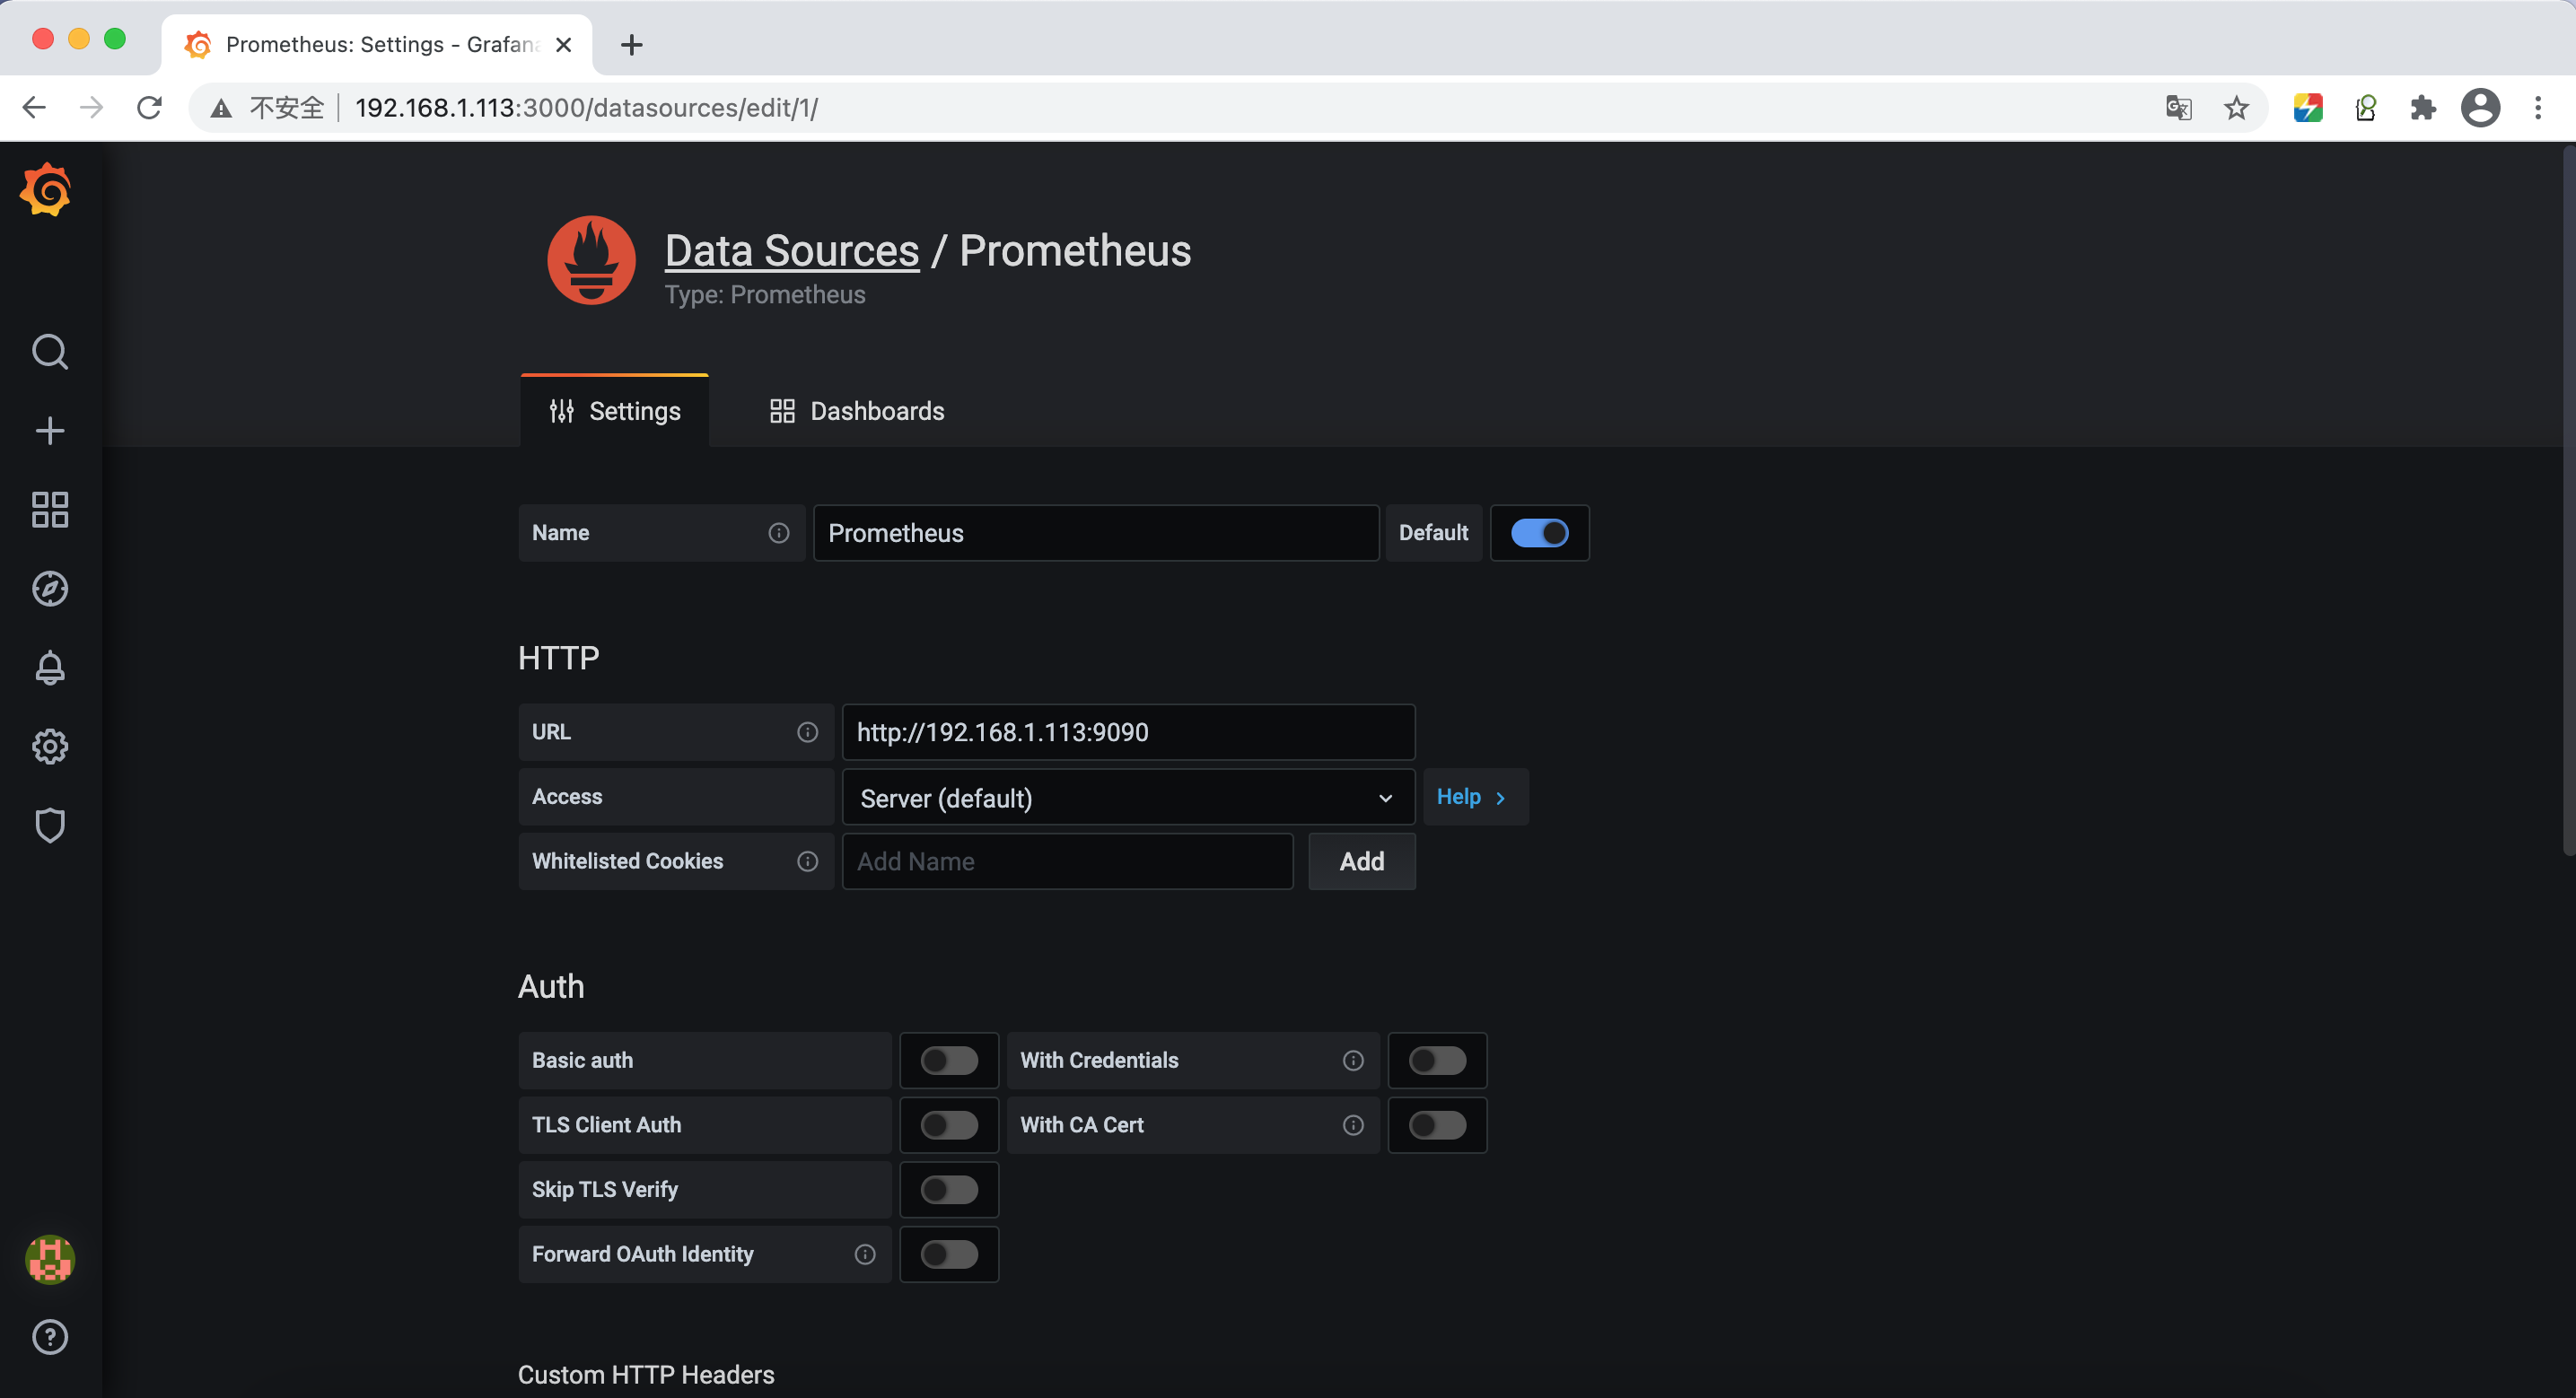
配置Prometheus数据源:
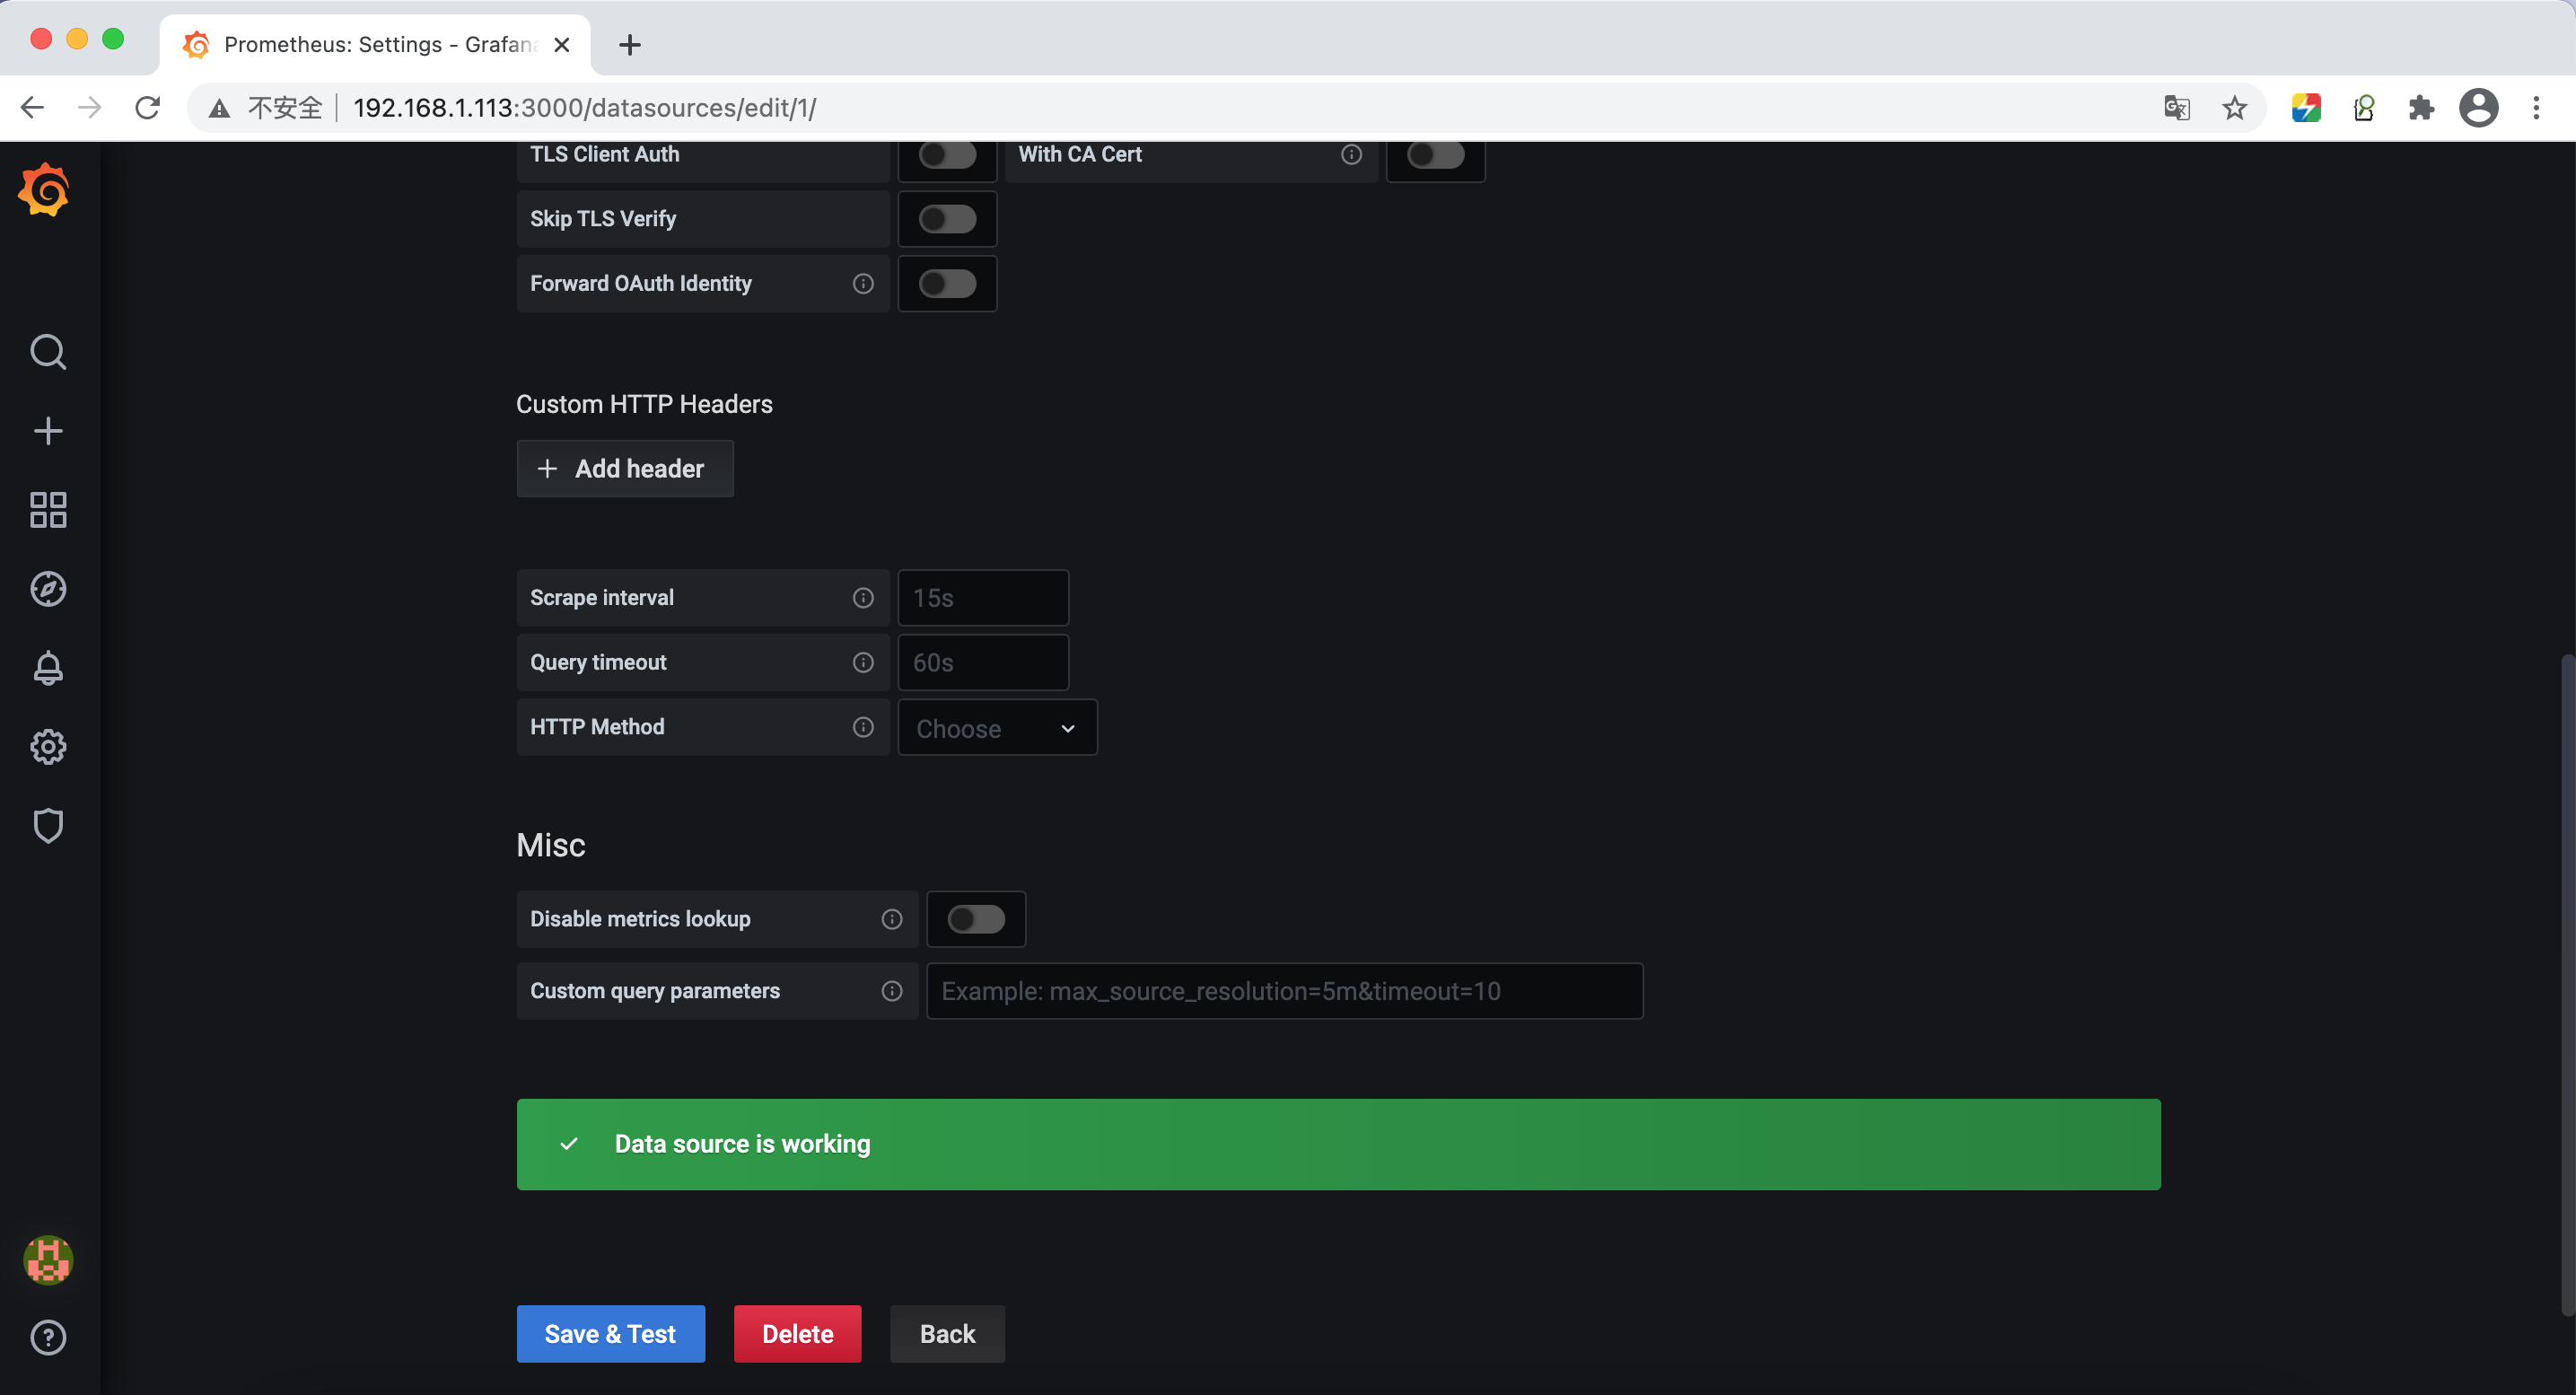
测试一下并保存:
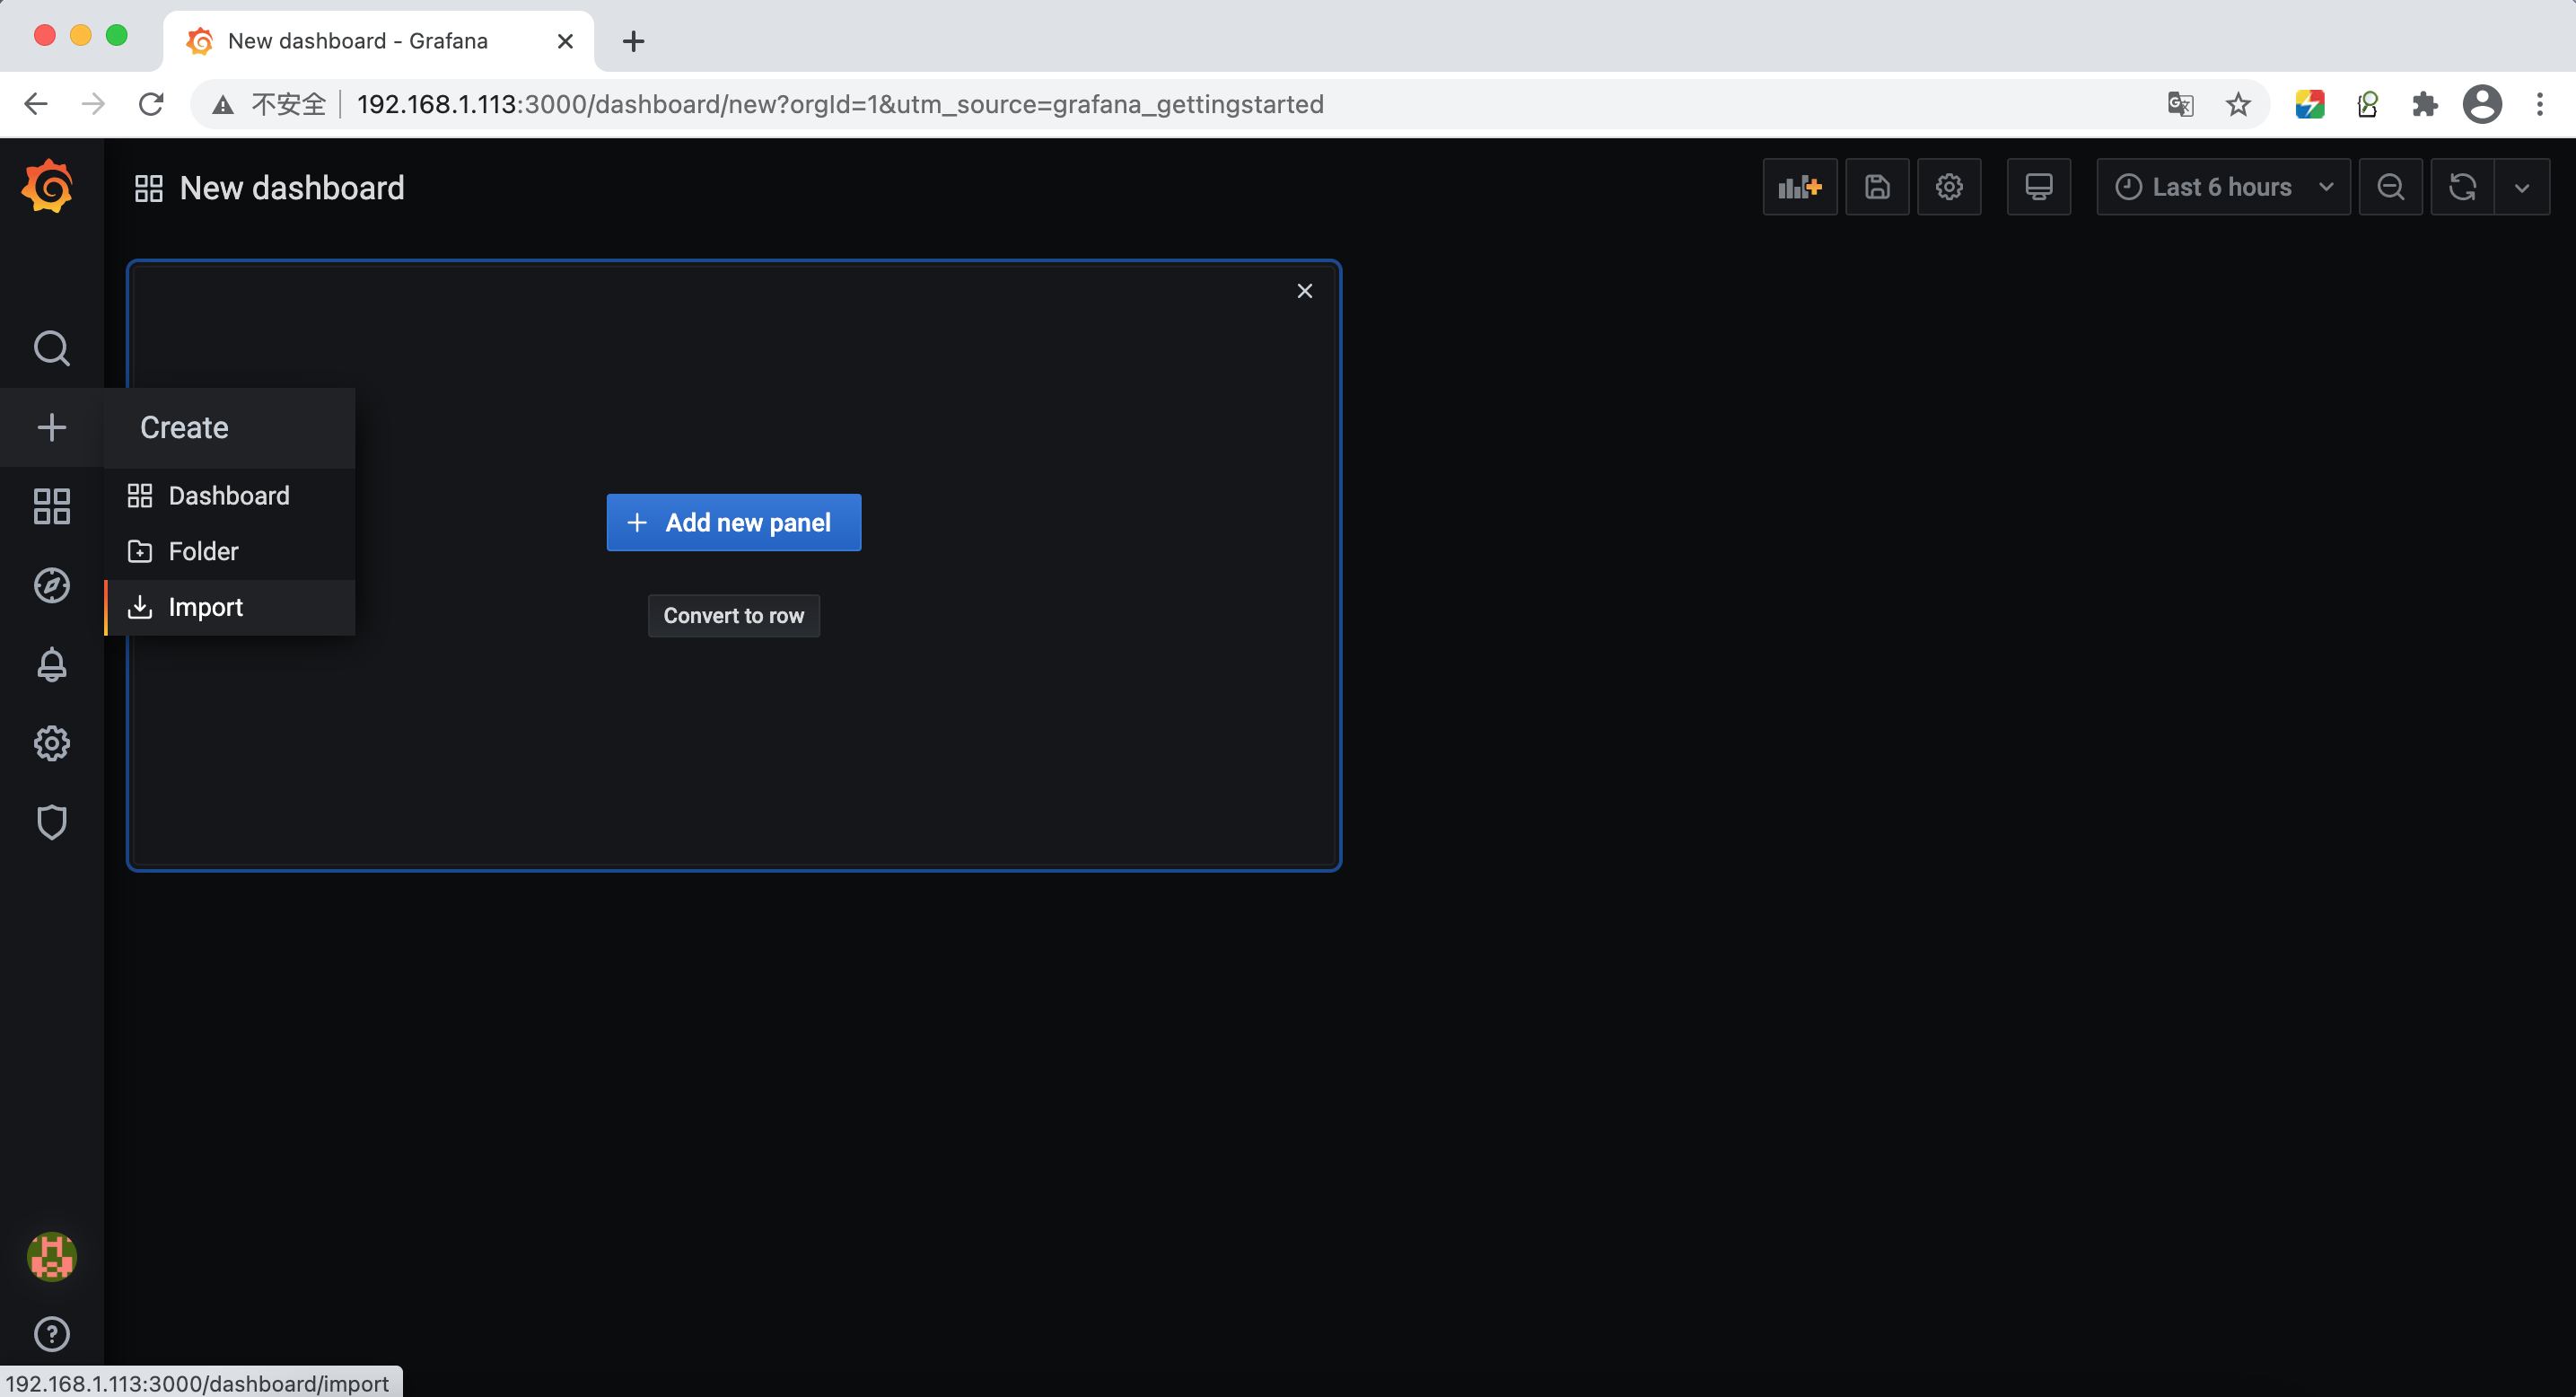
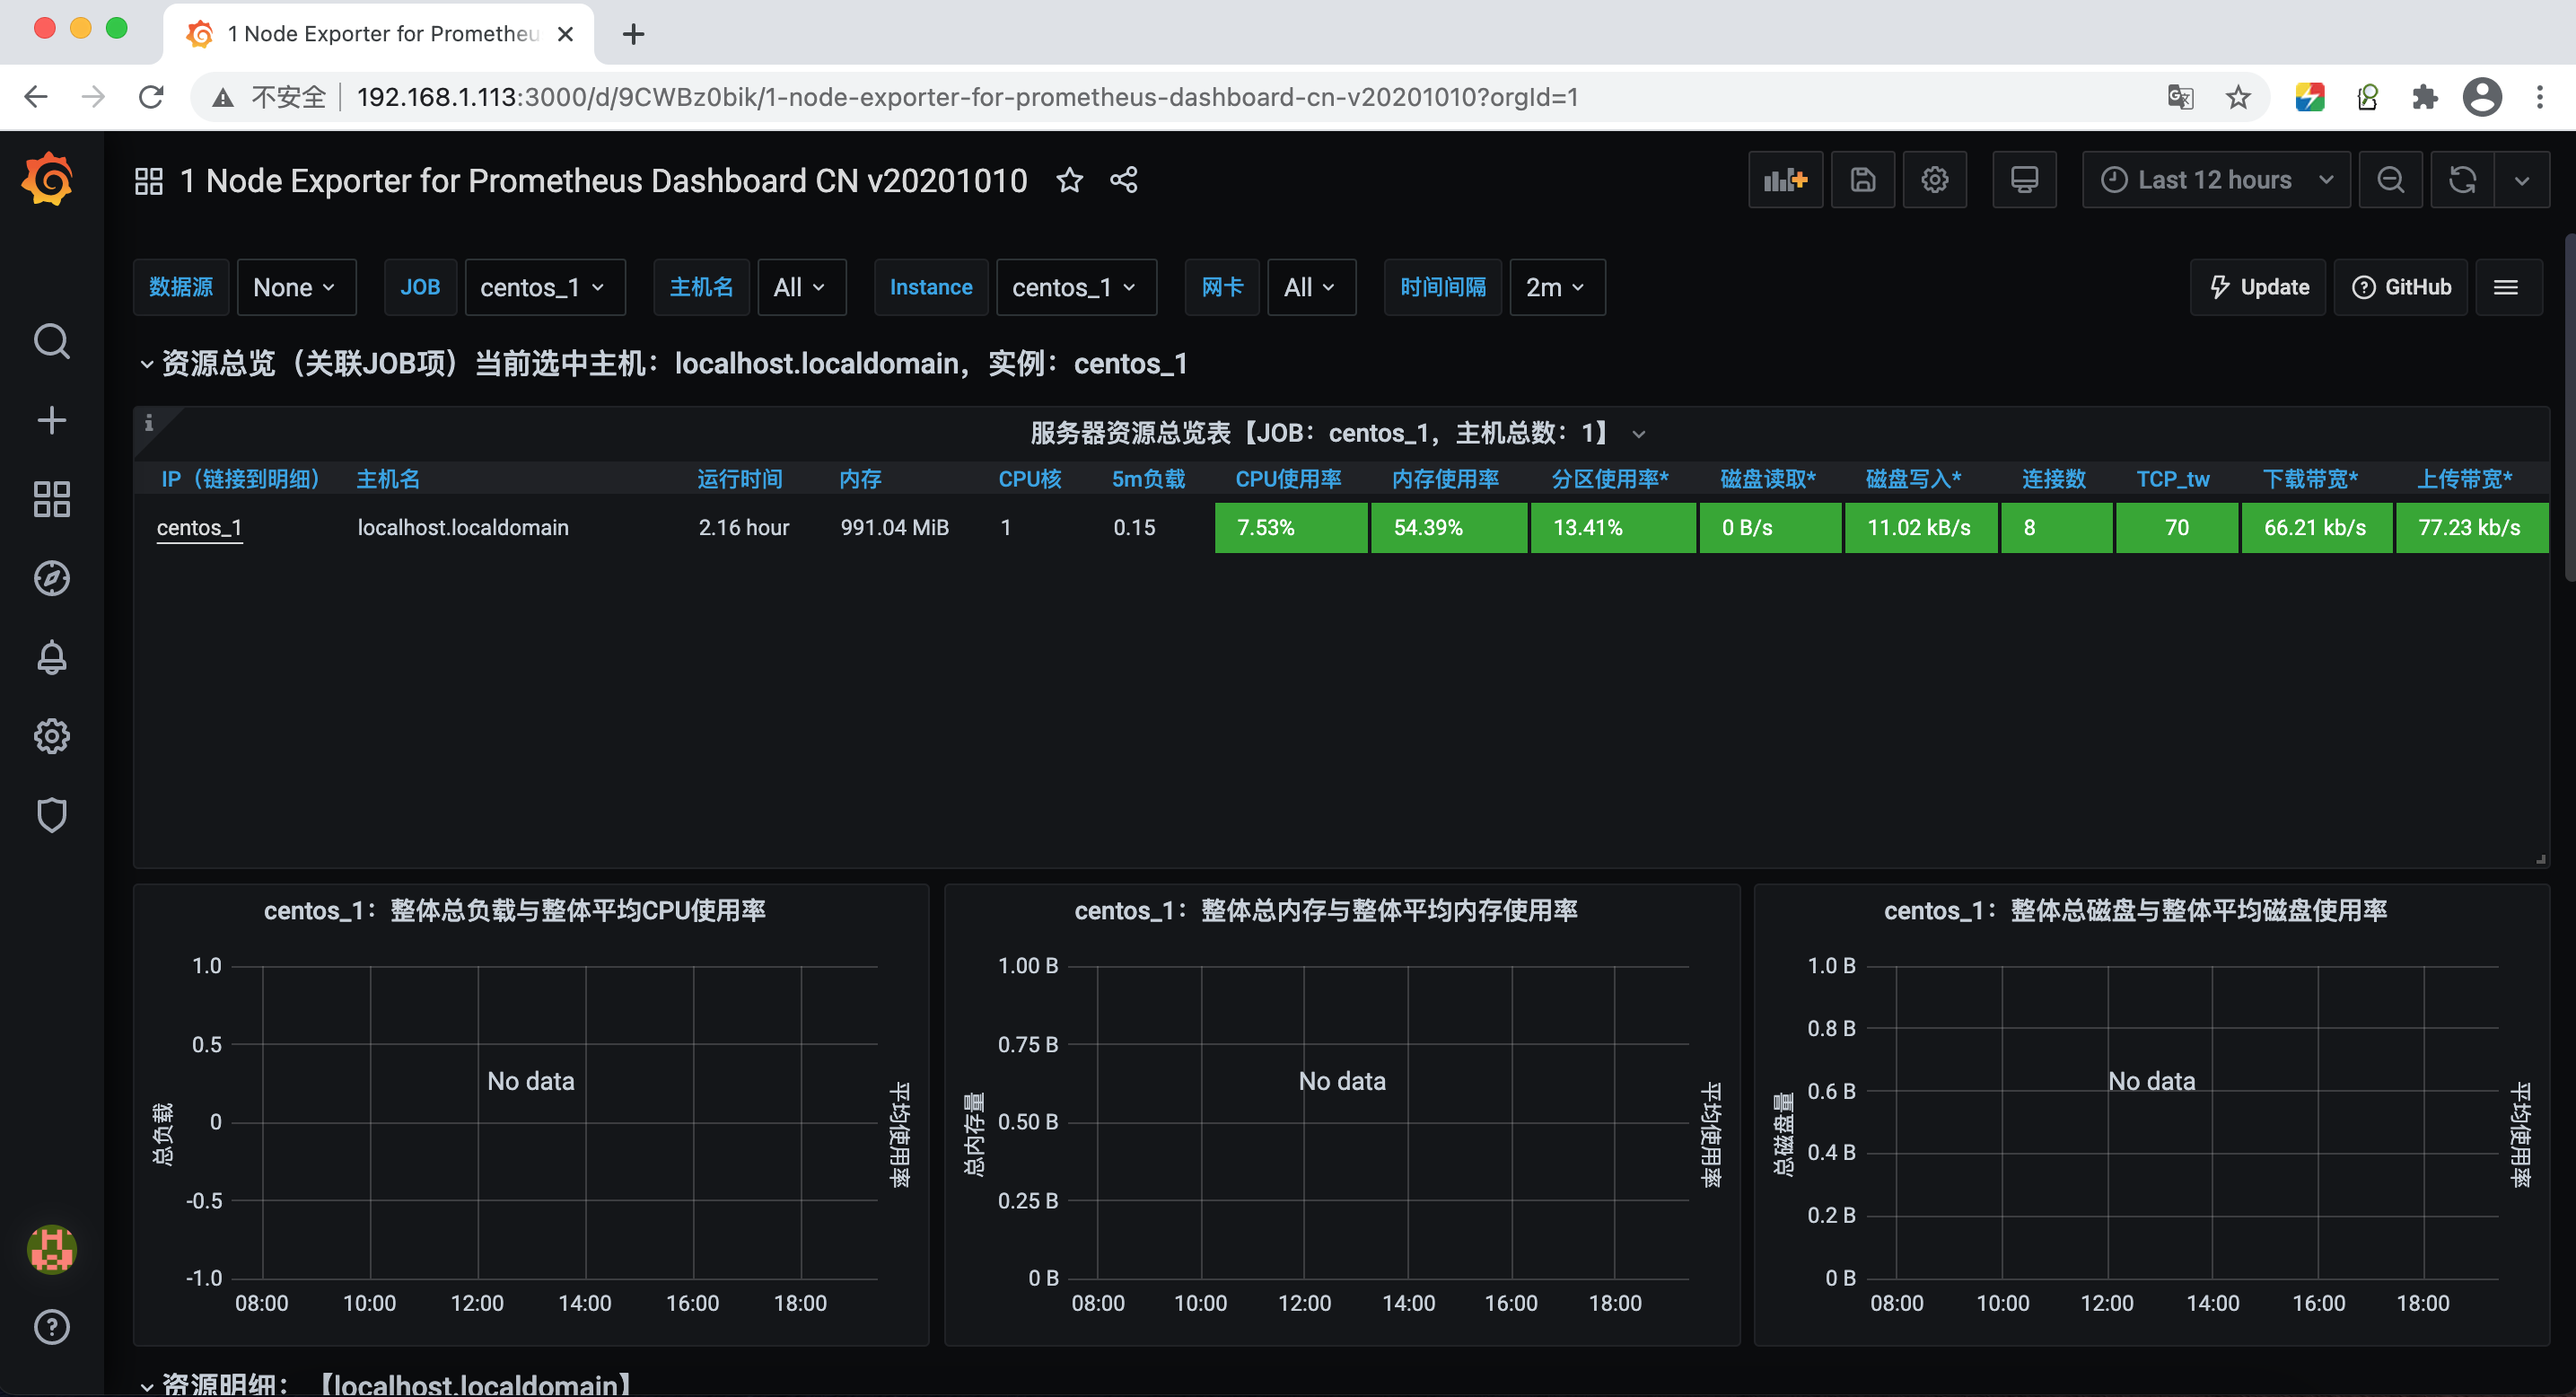
配置模板
可在官网搜索一个模板
https://grafana.com/grafana/dashboards?dataSource=prometheus
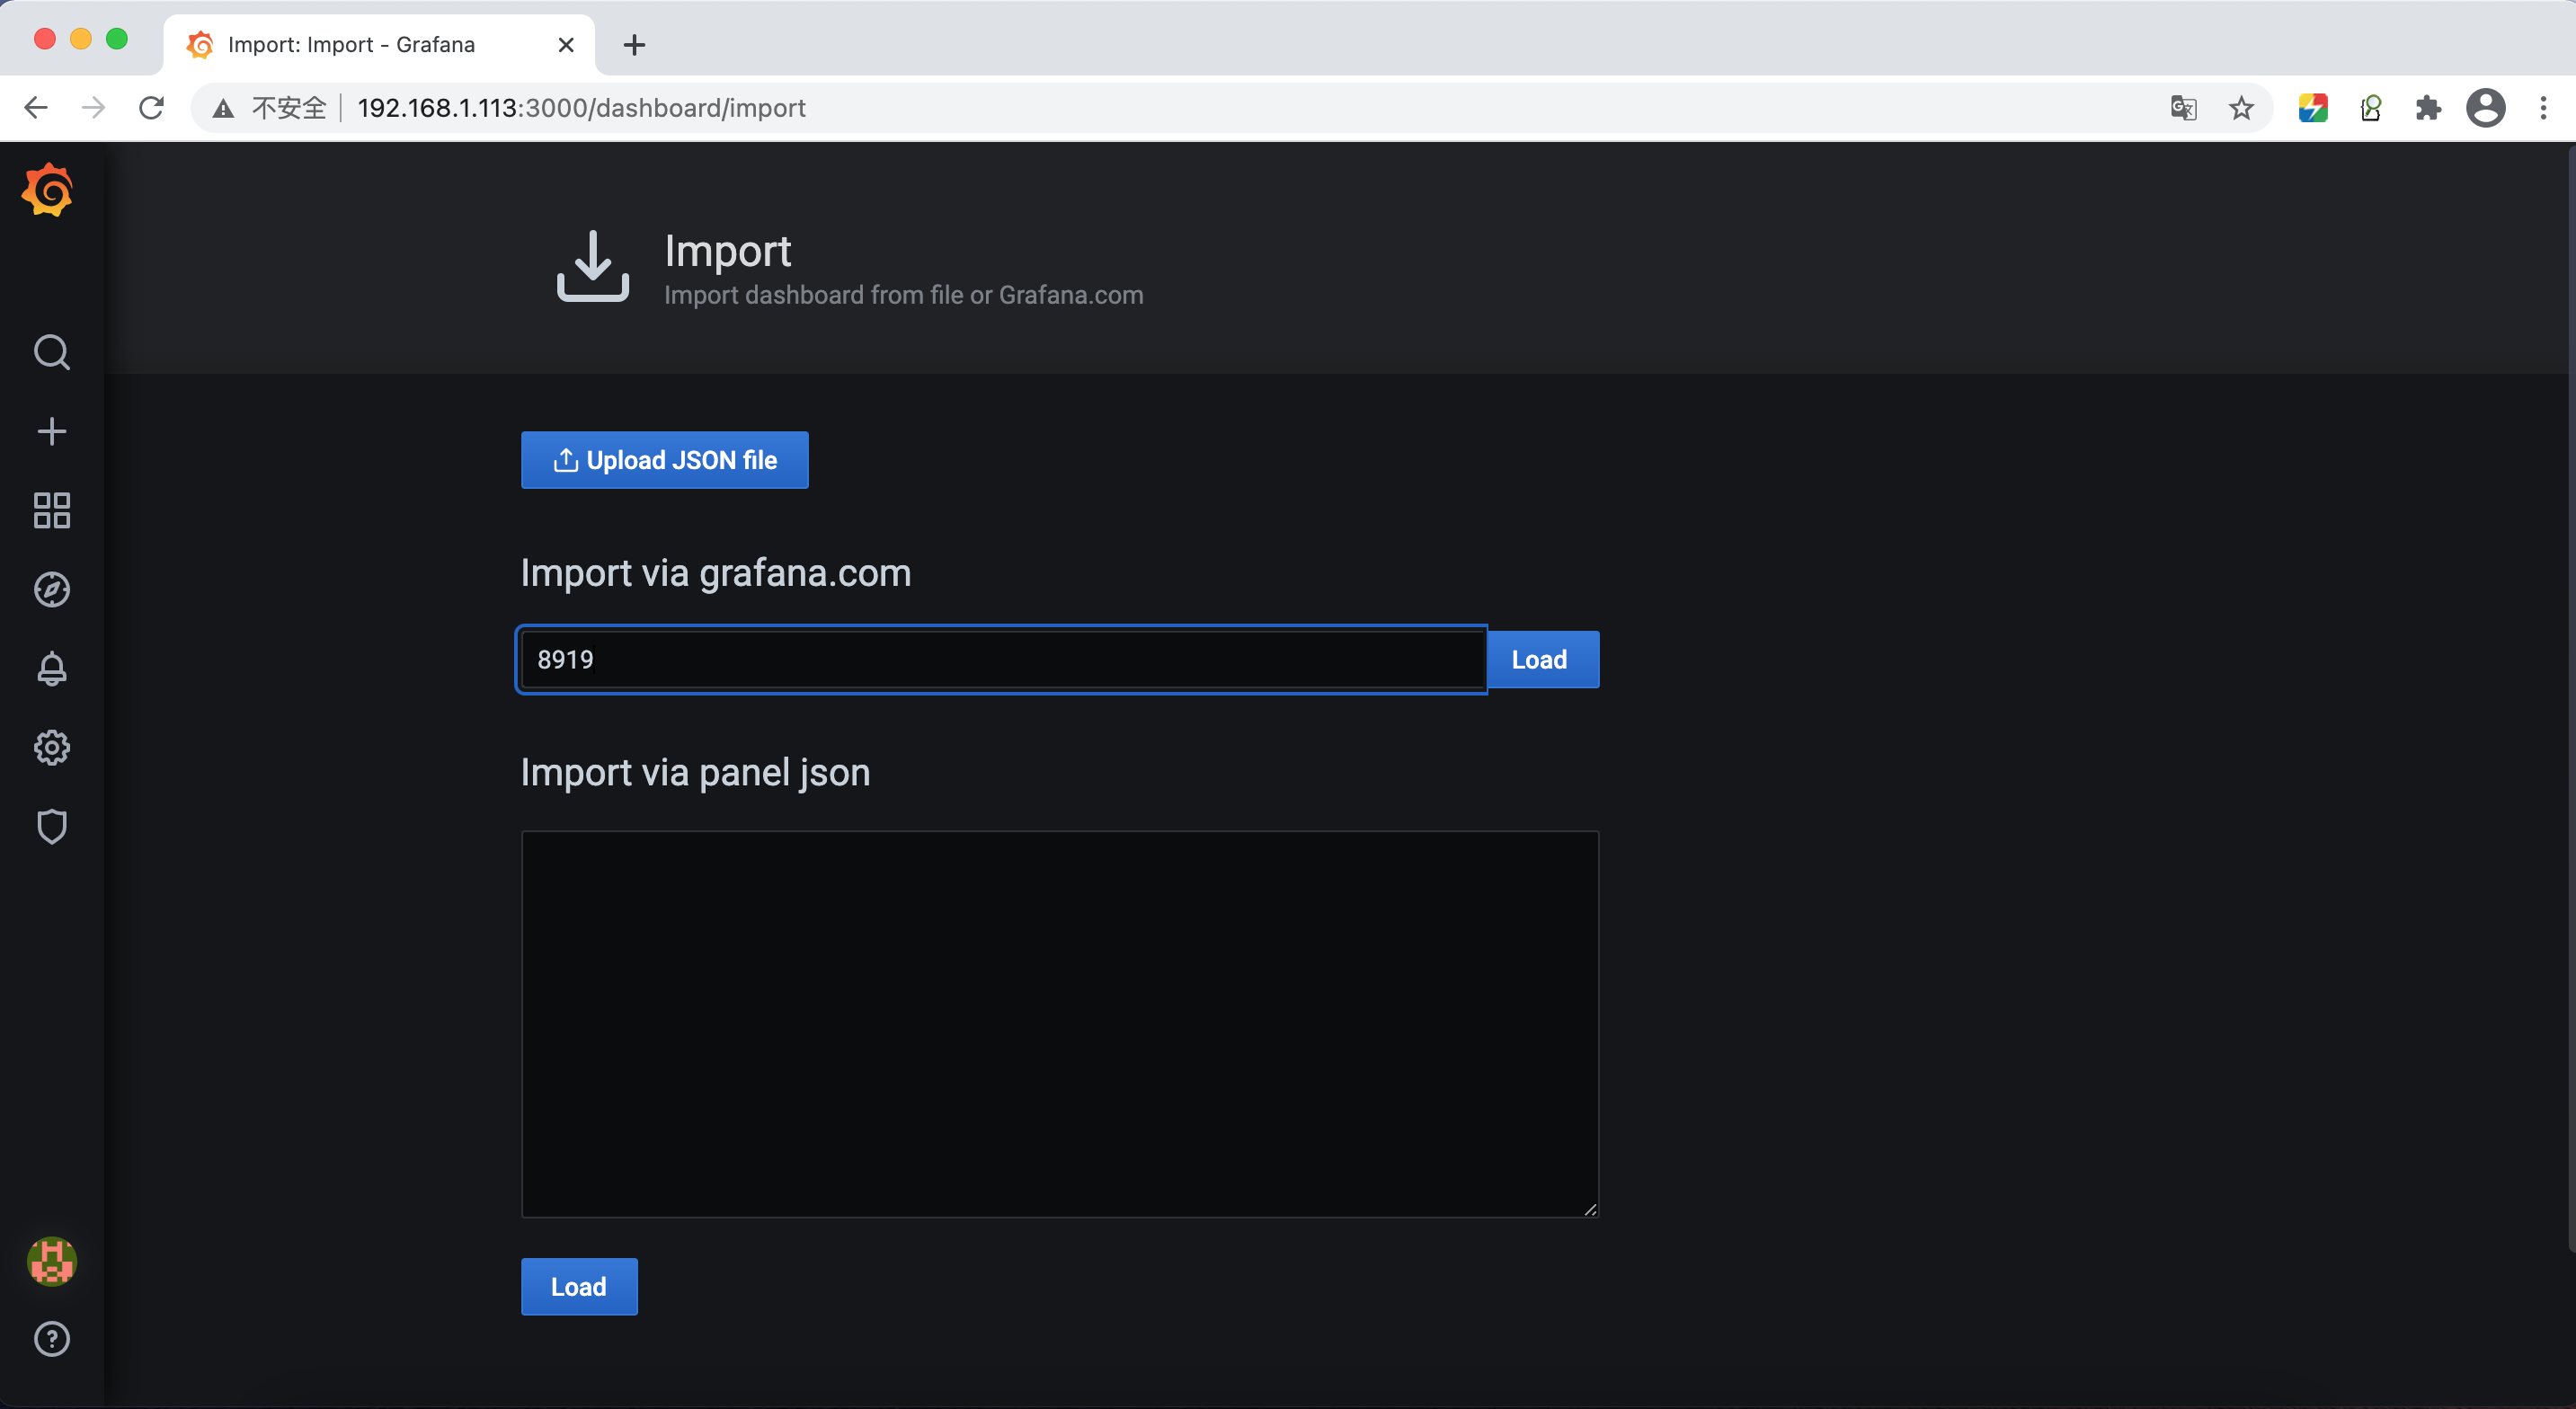
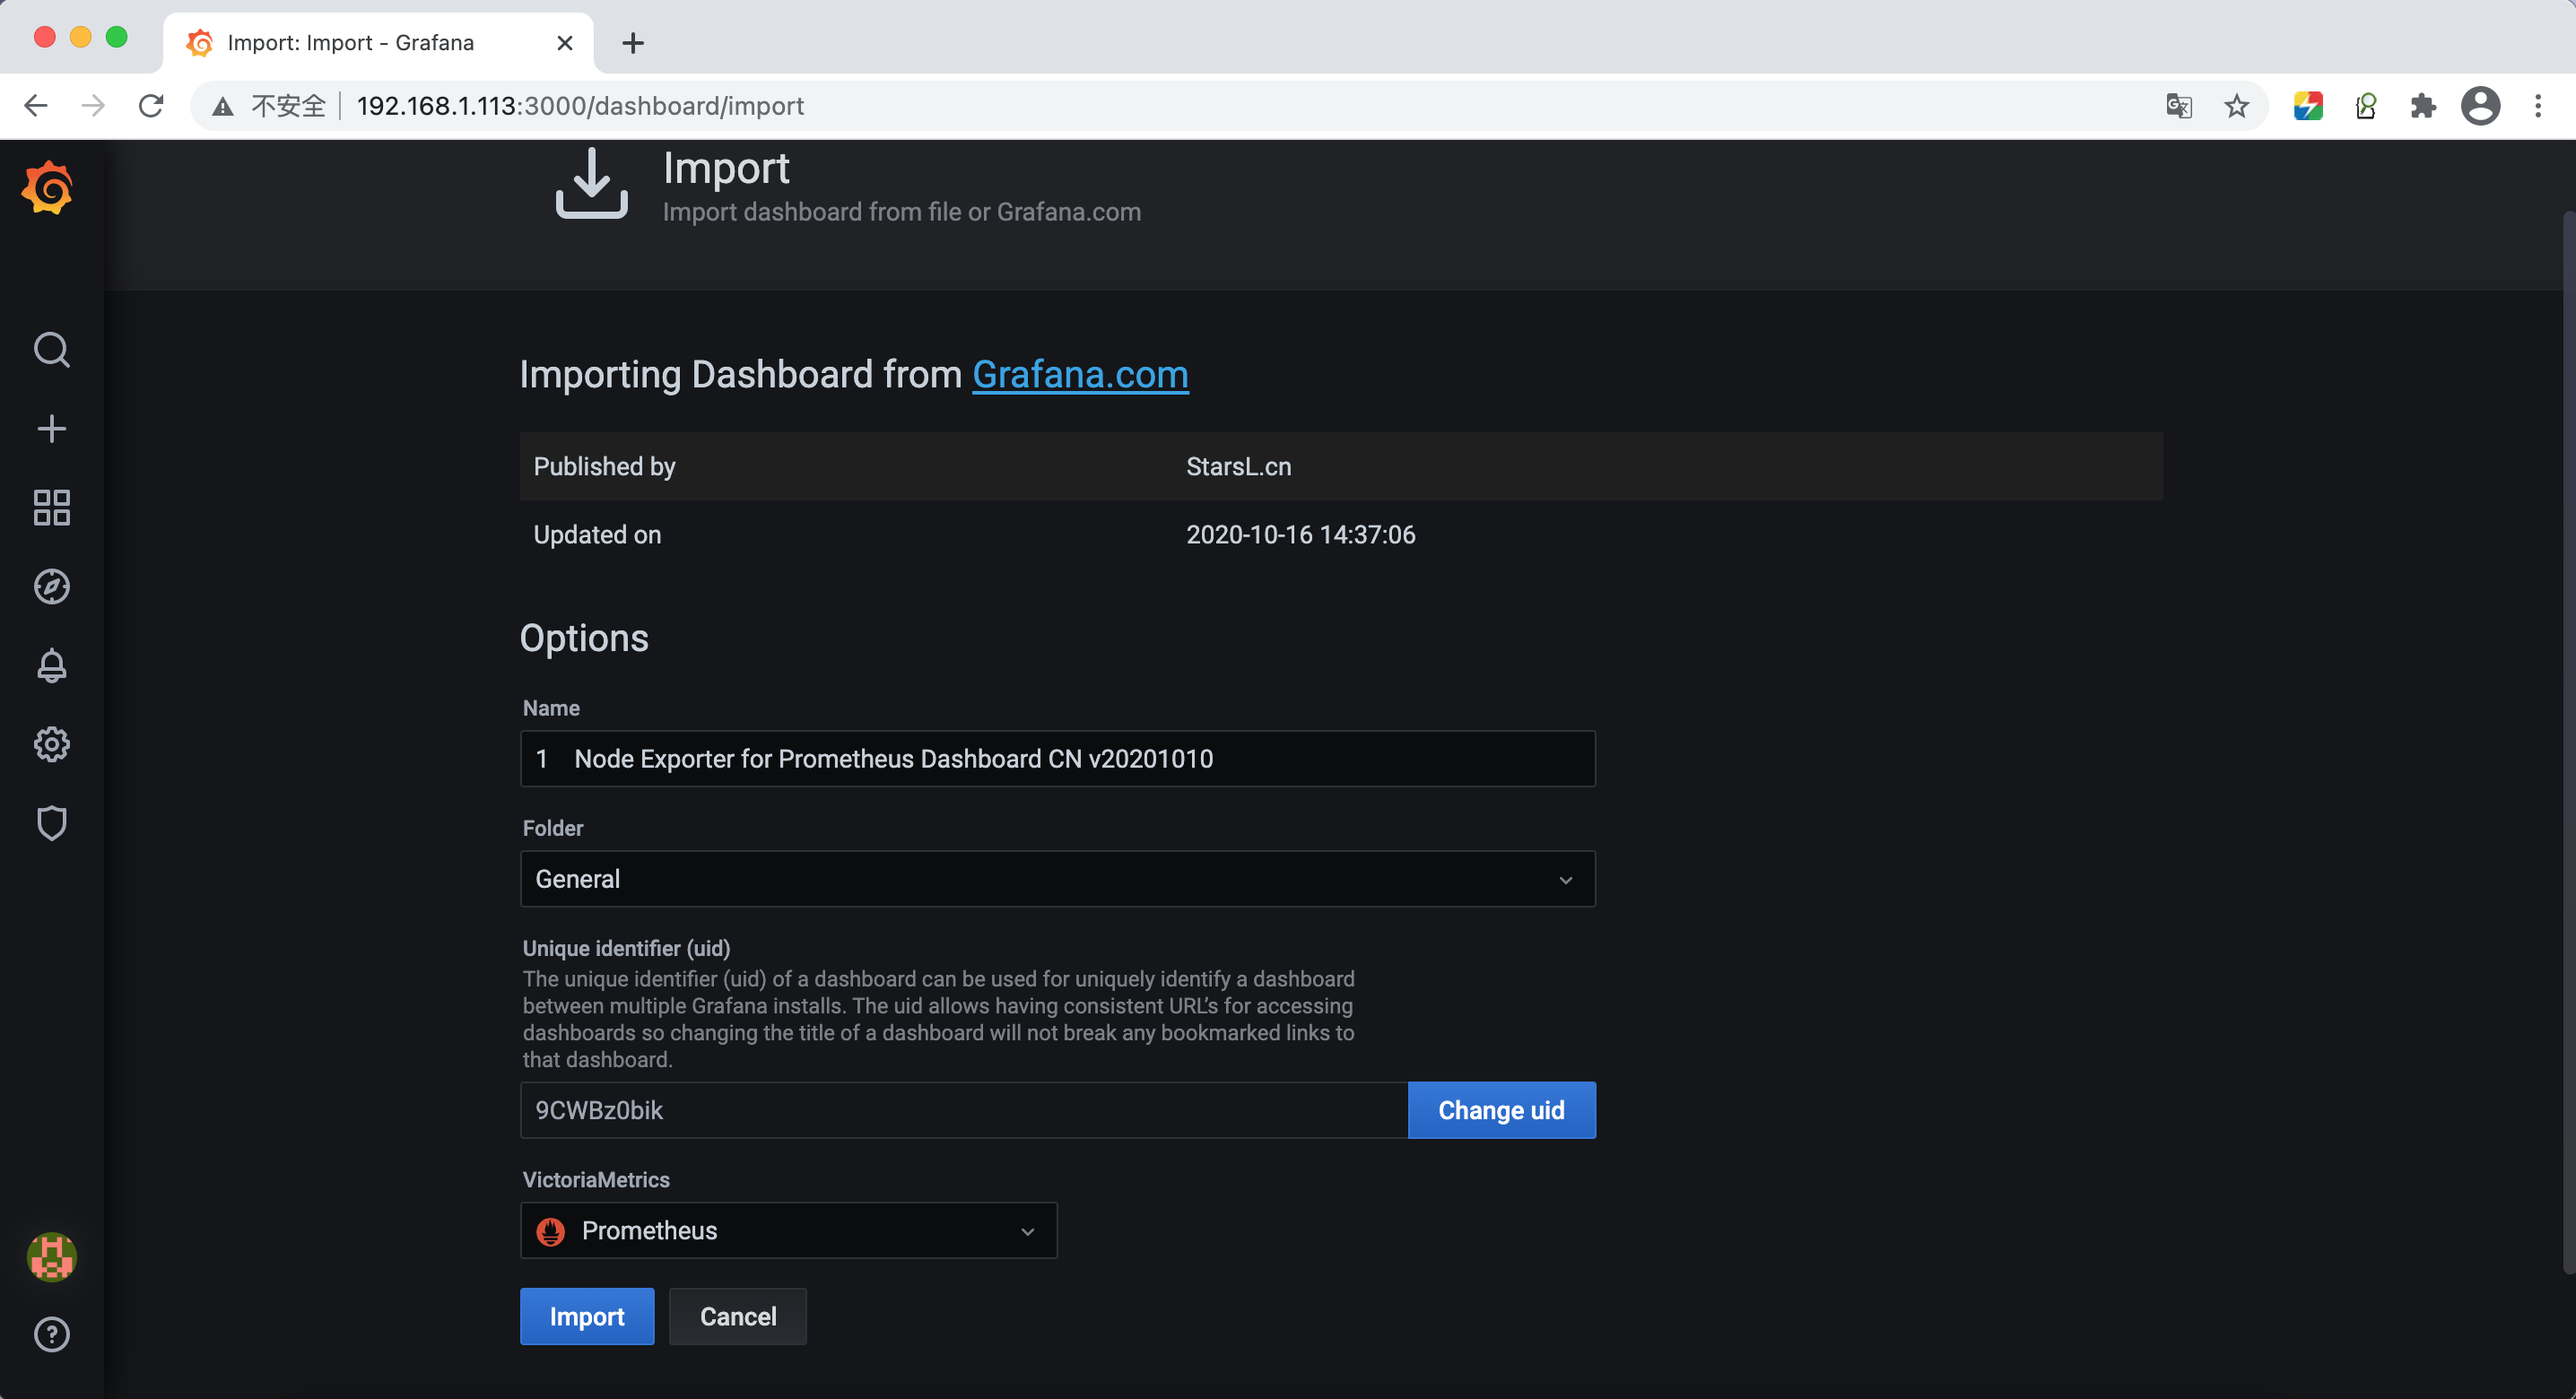
选择8919这个模板
https://grafana.com/grafana/dashboards/8919
四、安装cadvisor
docker pull google/cadvisor
# 拉取镜像
docker run -d
–name=cadvisor2020
–volume=/:/rootfs:ro
–volume=/var/run:/var/run:rw
–volume=/sys:/sys:ro
–volume=/var/lib/docker/:/var/lib/docker:ro
–volume=/cgroup:/cgroup:ro
–publish=9595:8080
–detach=true
–privileged=true
google/cadvisor
# 启动容器
firewall-cmd –zone=public –add-port=9595/tcp –permanent
firewall-cmd –reload
# 开放防火墙9595端口
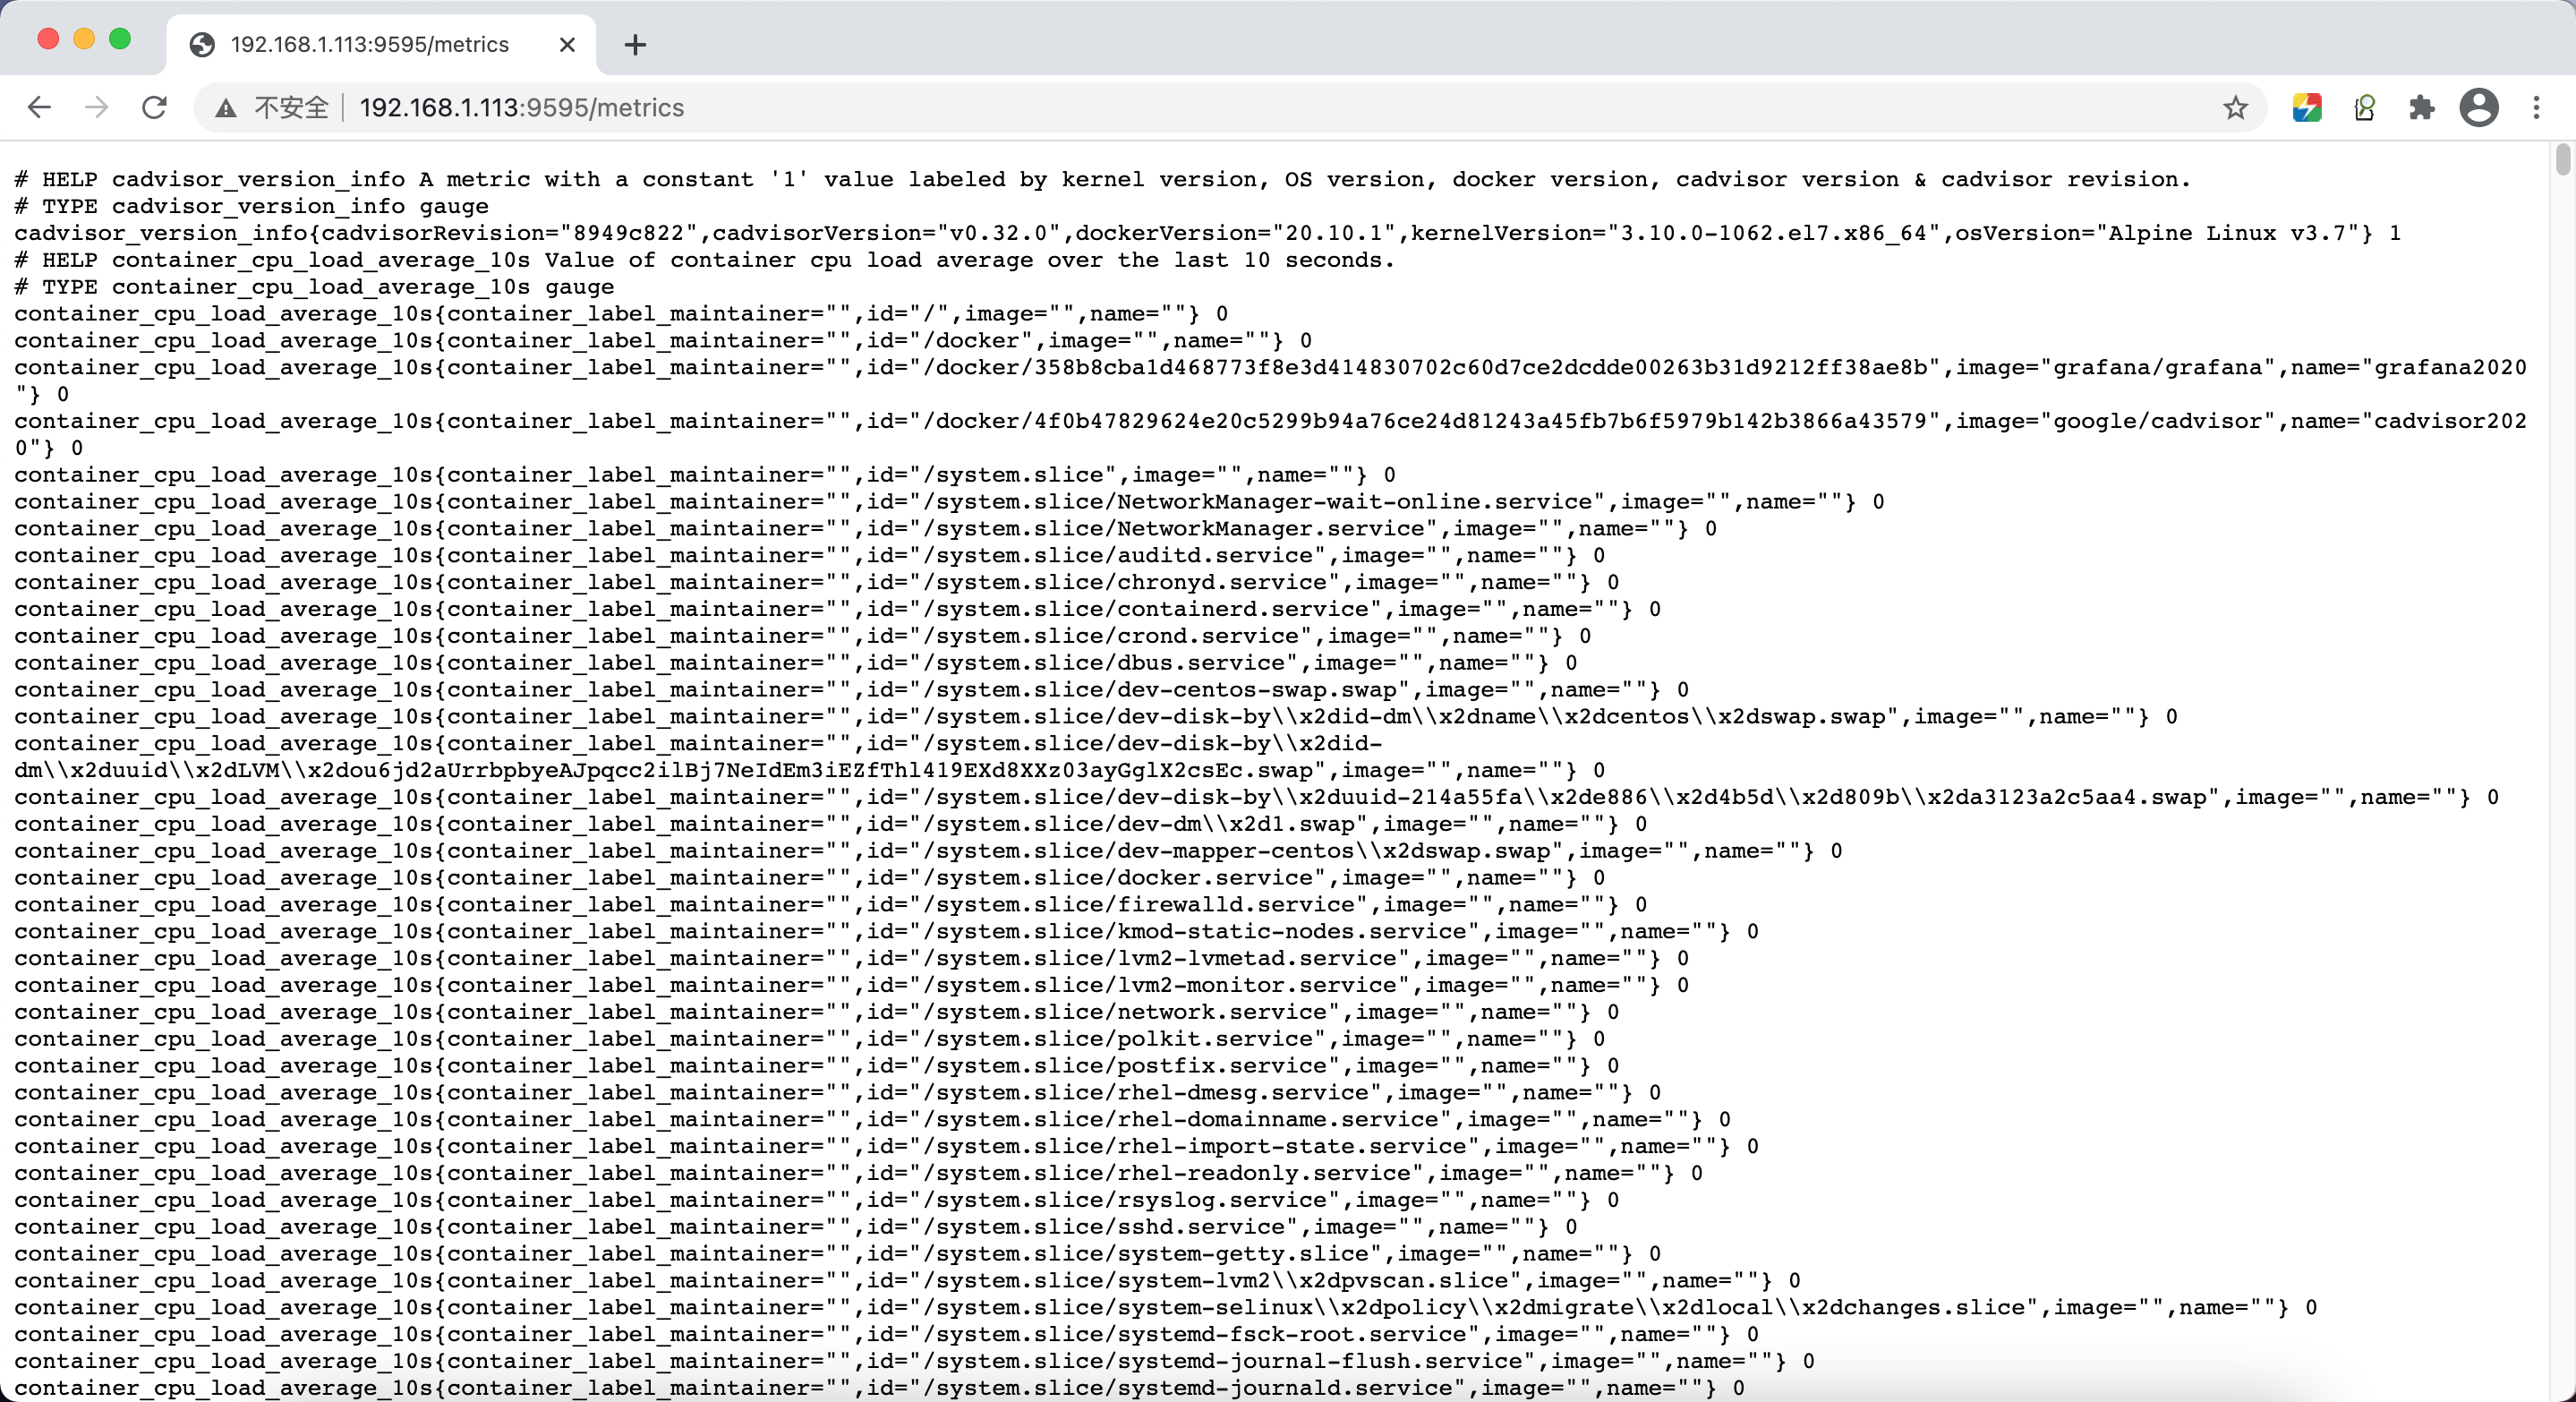
访问
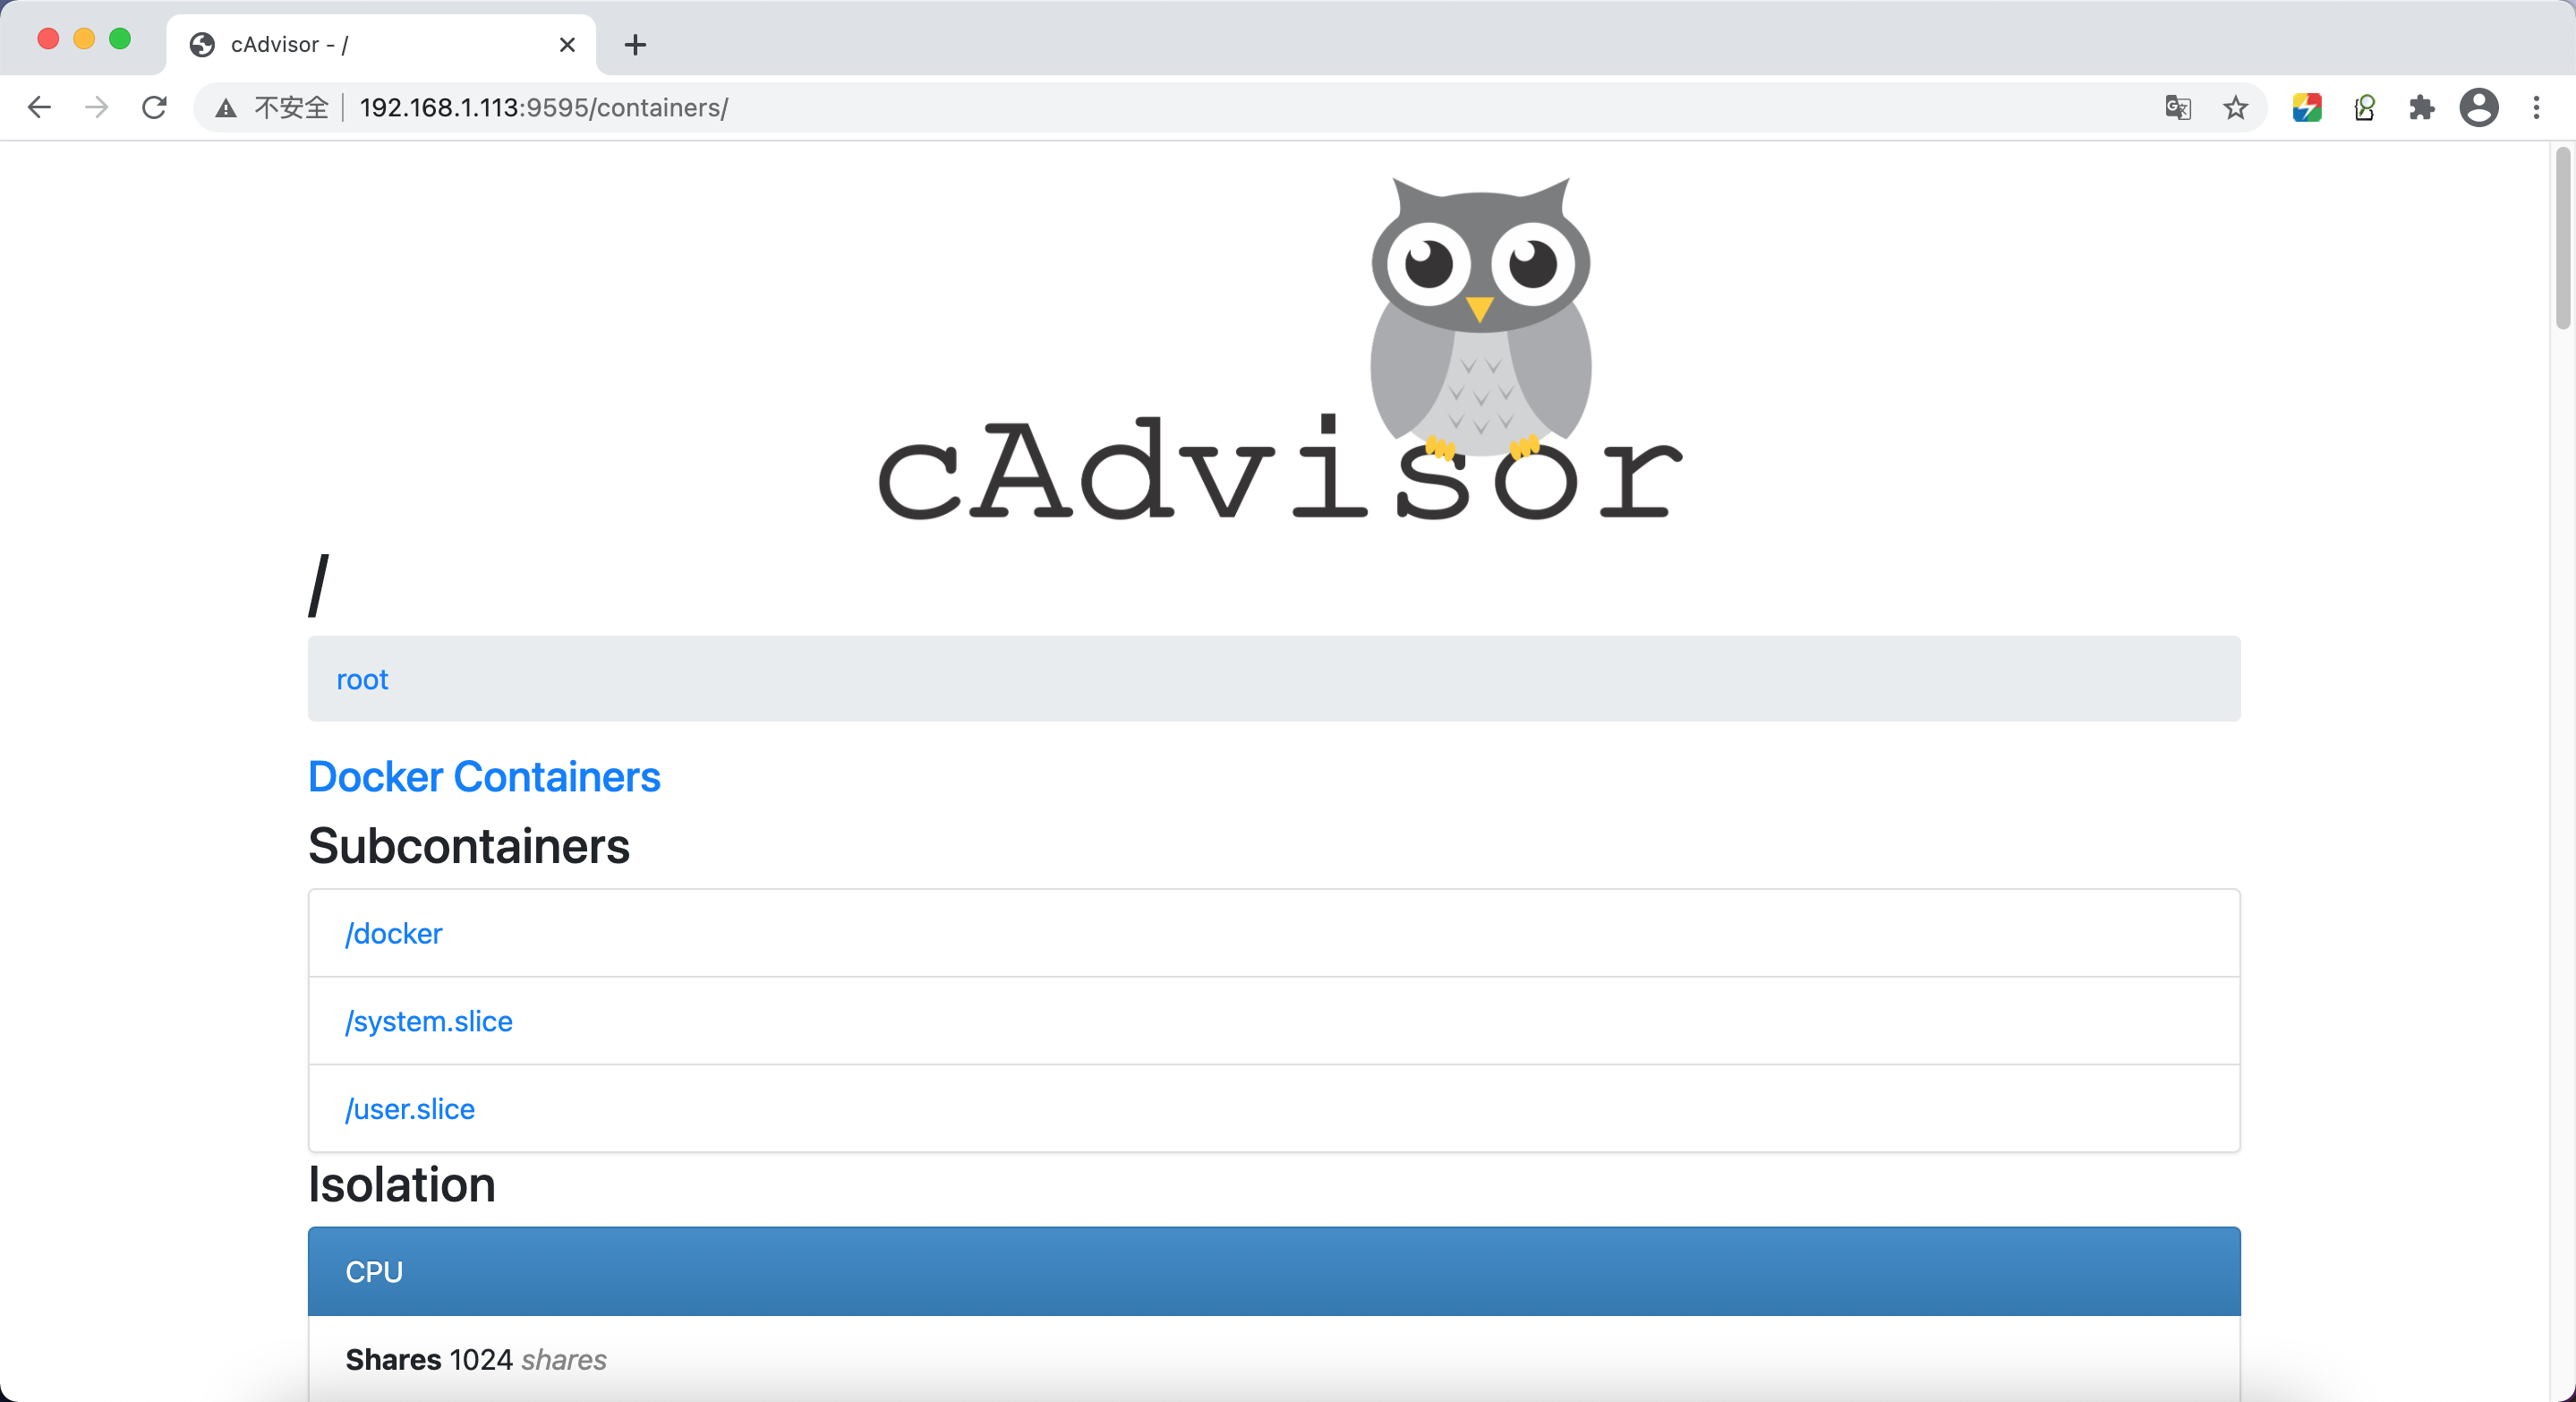
http://192.168.1.113:9595/metrics