1
2
3
4
5
6
7
8
9
10
11
12
13
14
15
16
17
18
19
20
21
22
23
24
25
26
27
28
29
30
31
32
33
34
35
36
37
38
39
40
41
42
43
44
45
46
47
48
49
50
51
52
53
54
55
|
import pandas as pd
import random
max_row = 21
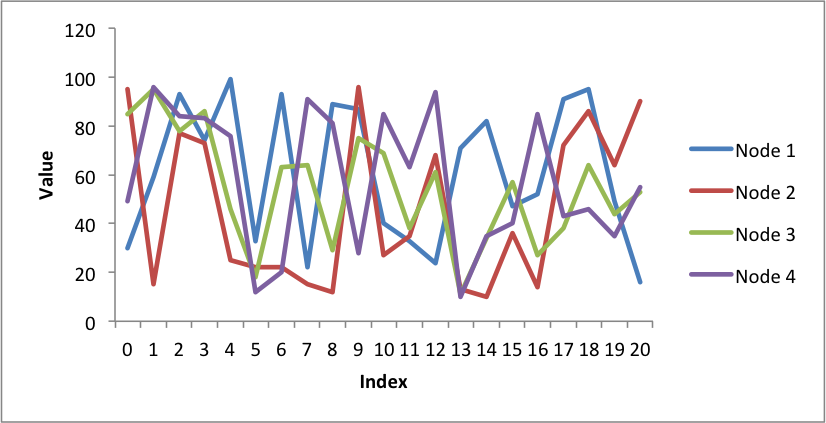
categories = ['Node 1', 'Node 2', 'Node 3', 'Node 4']
index_1 = range(0, max_row, 1)
multi_iter1 = {'index': index_1}
for category in categories:
multi_iter1[category] = [random.randint(10, 100) for x in index_1]
index_2 = multi_iter1.pop('index')
df = pd.DataFrame(multi_iter1, index=index_2)
df = df.reindex(columns=sorted(df.columns))
sheet_name = 'Sheet1'
writer = pd.ExcelWriter('pandas_chart_line.xlsx', engine='xlsxwriter')
df.to_excel(writer, sheet_name=sheet_name)
workbook = writer.book
worksheet = writer.sheets[sheet_name]
chart = workbook.add_chart({'type': 'line'})
for i in range(len(categories)):
col = i + 1
chart.add_series({
'name': ['Sheet1', 0, col],
'categories': ['Sheet1', 1, 0, max_row, 0],
'values': ['Sheet1', 1, col, max_row, col],
})
chart.set_x_axis({'name': 'Index'})
chart.set_y_axis({'name': 'Value', 'major_gridlines': {'visible': False}})
worksheet.insert_chart('G2', chart)
writer.save()
|